






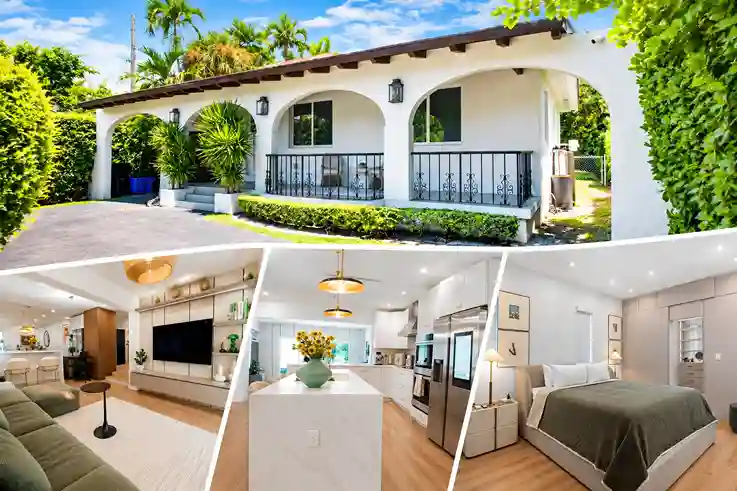
817 Tangier St Investment Analysis: Can Rent Support Price?
817 Tangier St investment analysis begins with an uncomfortable mismatch: the listing presents a polished 3-bedroom Coral Gables home at $1.399 million, while the available rental evidence points toward income that may not support the price. That makes this more than a question about a Coral Gables rental property or a Coral Gables real estate investment. It is a test of whether location, renovation, and prestige can overcome weak rental property cash flow.
The answer is not that the house has no value. The available evidence supports a different and more precise conclusion: 817 Tangier St may make sense to an owner-occupant, a cash buyer seeking personal use, or an investor with a strong appreciation thesis. It does not currently look like an attractive leveraged long-term rental at the asking price. The distinction matters because an attractive house and an attractive income investment are not the same asset.
The listing is plausible as a home. The income case is the problem.
The public listing describes a single-family residence with 1,572 square feet, three bedrooms, two bathrooms, a 5,350-square-foot lot, a 1950 construction date, an attached garage, and an asking price of $1,399,000. The public Redfin listing also describes updated interiors, designer finishes, a remodeled kitchen, central air, and a one-car garage. Those details may support buyer appeal. They do not, by themselves, establish rent, operating income, or investment return.
The same Redfin record shows a sale at $1,249,000 on April 30, 2025. The current ask is therefore $150,000 higher, or about 12.0 percent above the prior transaction. That comparison is informative but not conclusive. The property may have been renovated, and the listing history itself refers to improvements such as a new roof, impact windows and doors, plumbing, electrical work, and HVAC. The scope, quality, permit status, and cost of those improvements still require documentation. A buyer should not assume that a higher asking price is justified simply because the house looks newer in photographs.
There is also a small but important record discrepancy. Redfin’s current listing describes three bedrooms and two bathrooms, while the public-record section on the same page displays two beds and one bath. That does not prove that the listing is wrong. It does prove that bedroom and bathroom counts should be matched to the official county record, permits, and certificate-of-occupancy evidence before a financial model treats the advertised configuration as settled fact.
The listing also says the home is updated and contemporary-modern. That is marketing language, not an inspection report. Roof age, HVAC condition, electrical capacity, plumbing, drainage, mold, termites, structural condition, impact-window documentation, insurance eligibility, flood exposure, and unpermitted work can all change the economics. A visually attractive renovation can reduce near-term maintenance, but it can also create a misleading sense of certainty if the buyer has not verified the underlying records.
The first analytical rule is therefore simple: the property facts are partly documented, the condition is only partly documented, and the rental income is not documented by an executed lease.
What does a $1.399 million purchase need to earn?
A rental investment converts a purchase price into a stream of operating income. That stream must cover more than the mortgage. It must absorb vacancy, credit loss, taxes, insurance, maintenance, capital replacements, management, leasing costs, owner-paid services, and occasional unpleasant surprises.
The supplied underwriting analysis uses a conventional long-term-rental structure. It assumes 25 percent down, a 30-year fixed loan at 7.0 percent, eight percent combined vacancy and credit loss, professional management, maintenance, replacement reserves, estimated insurance, and reported property taxes. The assumed loan is $1,049,250. Estimated annual debt service is approximately $83,768, or $6,981 per month.
Those financing assumptions are not a forecast of the buyer’s actual loan. They are a transparent screening case. A buyer who receives materially cheaper financing should rerun the model. A buyer who pays cash should remove the debt-service line but should not mistake the absence of a mortgage for a strong yield.
The central question is what rent can be supported by current evidence. The available nearby evidence does not justify using the $8,000 monthly figure that appeared in a Zillow search result as the base case. The Zillow page was not independently reviewable for that rental result, and the figure conflicts with other public market signals. The stronger preliminary underwriting range is approximately $4,500 to $6,000 per month for a six-month-or-longer lease, assuming the property is genuinely updated, legally occupiable, competitively marketed, and supported by current demand.
The base case uses $5,250 per month. That is an estimate, not a confirmed lease.
| Scenario | Monthly rent | Gross annual rent | Less 8% vacancy and credit loss | Effective annual income |
| Conservative | $4,500 | $54,000 | $4,320 | $49,680 |
| Base | $5,250 | $63,000 | $5,040 | $57,960 |
| Optimistic | $6,000 | $72,000 | $5,760 | $66,240 |
The eight-percent deduction is not an assertion that vacancy will equal exactly eight percent. It is a reserve for time without a tenant, nonpayment, bad debt, and related income leakage. A property that receives a strong application every year can perform better. A property that experiences a lengthy turnover, a failed tenant, or a concession can perform worse.
The operating-expense model then applies approximately $10,430 for annual property taxes, $6,000 for insurance, management at eight percent of effective income, maintenance at five percent of gross rent, replacement reserves at five percent of gross rent, and $3,000 for landscaping, utilities, licensing, accounting, and other services. No HOA cost is included because none was identified, but that is a pending verification rather than proof that no restriction or assessment exists.
At the base rent, the result is approximately $27,593 of net operating income, or NOI. NOI is the income remaining after property-level operating expenses but before mortgage debt, income taxes, depreciation, and the investor’s opportunity cost of capital.
That figure is the hinge of the entire case. At $27,593 of NOI, the property produces a cap rate analysis result of approximately 1.97 percent:
$27,593 NOI ÷ $1,399,000 purchase price = approximately 1.97 percent cap rate.
A capitalization rate, or cap rate, is a rough measure of unleveraged property yield. It does not include mortgage payments. It is useful because it asks what the property itself produces before the buyer’s financing choice. It is not a complete return measure, because it excludes appreciation, principal repayment, taxes, and selling costs. But it is a useful first test of whether the price is connected to income.
The base cap rate is exceptionally thin for a property that still carries hurricane, flood, insurance, maintenance, and concentration risks. More importantly, it is thin before the mortgage is paid.
The mortgage turns a low yield into a monthly obligation
Subtracting estimated annual debt service of $83,768 from base NOI of $27,593 produces approximately negative $56,175 per year, or negative $4,681 per month before tax. The base debt-service coverage ratio, or DSCR, is approximately 0.33.
DSCR compares NOI with required debt service. A DSCR of 1.00 means the property’s NOI exactly covers scheduled debt payments. A DSCR of 1.20 means NOI is 20 percent above debt service, a common screening level in commercial and income-property underwriting. A DSCR of 0.33 means the property’s operating income covers only about one-third of the scheduled debt service.
| Measure | Base-case result | What it says |
| Purchase price | $1,399,000 | Current asking price, not a closed sale |
| Loan amount | $1,049,250 | 75% loan-to-price assumption |
| Annual NOI | $27,593 | After modeled operating expenses, before debt |
| Annual debt service | $83,768 | 30-year loan at assumed 7.0% rate |
| Annual cash flow before tax | −$56,175 | NOI less debt service |
| Monthly cash flow before tax | −$4,681 | Ongoing cash contribution implied by the model |
| Cap rate | 1.97% | NOI divided by purchase price |
| DSCR | 0.33 | NOI divided by annual debt service |
| Estimated cash-on-cash return | −13.2% | Annual cash flow divided by modeled initial cash invested |
The estimated initial cash investment is approximately $426,720, including the 25 percent down payment, three percent closing costs, $10,000 of initial repairs, and $25,000 of cash reserves. That estimate excludes furniture, major renovation, lender points, and insurance-premium adjustments. Dividing the annual negative cash flow by that initial cash produces a cash-on-cash return of approximately negative 13.2 percent.
This is not a small underperformance caused by one month of vacancy. It is negative leverage. Negative leverage occurs when the property’s unleveraged yield is below the effective cost of borrowed money, so adding debt makes the equity outcome worse rather than better. Here, the property’s modeled income is too small to support the debt burden by a wide margin.
The property would require approximately $11,522 per month in rent to reach zero pre-tax cash flow under the stated financing and operating assumptions. That is more than twice the $5,250 base rent. The model indicates approximately $12,192 per month to produce $500 in monthly cash flow and approximately $12,862 per month to produce $1,000.
Those figures are not rent forecasts. They are diagnostic thresholds. They show how far the existing economics would need to move before the investment stops requiring a monthly subsidy.
The $8,000 rent claim does not rescue the deal without proof
It is tempting to solve the analysis by selecting the highest visible rent number. The $8,000 monthly figure is precisely the kind of number that can pull an investment model toward a desired conclusion. The problem is not that $8,000 is impossible in every Coral Gables context. The problem is that the number is not a verified executed lease for this property, and it conflicts with the surrounding evidence.
At $8,000 per month, gross annual rent would be $96,000. After an eight-percent vacancy and credit-loss deduction, effective income would be $88,320. Even if the operating-expense model remained otherwise unchanged, the property would still need to carry the mortgage, and the resulting cash flow would not automatically become attractive. A verified arm’s-length lease at $8,000 would materially change the underwriting, but it would not eliminate the need to check lease duration, concessions, tenant-paid utilities, furnishing, commissions, renewal probability, and whether the rent is a one-time promotional outcome.
A rent estimate is not a rent roll. A listing is not a signed lease. A portal algorithm is not an appraisal. These distinctions are basic, but they are often blurred when a property’s asking price requires an aggressive income assumption.
The most useful next document would be a current rental-market analysis from a local professional plus at least one executed lease comp for a comparable three-bedroom, two-bath single-family home. The comparable should be similar in location, condition, lot, parking, lease duration, and furnishing. A newer, larger house with an extra bathroom can establish demand in the neighborhood without proving that this 1950 home can command the same price.
Same-street evidence supports demand, not unlimited pricing power
The nearby rental evidence is mixed but directionally useful. A smaller three-bedroom, two-bath property at 815 Tangier St has historical listing evidence around $3,500 per month, later reduced to $2,925 before removal, while automated estimates were around the high-$3,000s to low-$4,000s. That is not a current signed lease, but it is a same-street reference point.
The more relevant recent rent signal is 820 Tangier St, a newer three-bedroom property with three bathrooms and reported size figures that vary across portals. It was listed around $5,500 per month in September 2025 and later shown as rented or removed. That outcome is more useful than a purely automated estimate, but it is not a perfect comp. The property is newer, has an extra bathroom, and may be larger.
A smaller two-bedroom, two-bath property at 837 Tangier St provides lower-bound context. Its historical rental outcomes were below the current subject-property range, but the bedroom count, size, and timing make it an inferior direct comparison.
| Property | Evidence strength | Why it matters | Why it cannot be copied mechanically |
| 815 Tangier St | Historical listing and automated estimates | Same street, similar bedroom and bathroom count | Smaller, older rental evidence, not a current executed lease |
| 820 Tangier St | Recent $5,500 listing outcome and portal data | Closest recent three-bedroom rent signal | Newer, extra bathroom, and conflicting reported size |
| 837 Tangier St | Historical rent outcomes and estimates | Same street and useful lower-bound context | Two bedrooms and smaller than the subject |
| 817 Tangier St | No verified current executed lease | Subject property and current asking price | $8,000 portal figure is unverified and should not be the base case |
The evidence supports a preliminary budget closer to $5,000–$5,250 than $8,000. That range could be wrong. It could be too low if the renovation is exceptional and a qualified tenant values the location. It could be too high if the property’s condition, layout, insurance cost, or lease restrictions reduce demand. The point is not false precision. The point is to prevent an unverified high estimate from carrying a $1.399 million purchase price.
Coral Gables is affluent, but the marginal renter still has a budget
Coral Gables has strong demographic characteristics. The U.S. Census Bureau’s QuickFacts data reports a July 2025 population estimate of 49,578, 19,210 households, a 64.5 percent owner-occupied housing rate, a median owner-occupied home value of $1,089,900, and median gross rent of $2,373 for 2020–2024. Median household income is reported at $134,216, while per-capita income is $87,693.
The city is also highly educated and international. The Census reports that 73.6 percent of adults have a bachelor’s degree or higher, 37.7 percent of residents are foreign-born, and 60.7 percent of residents age five and older speak a language other than English at home. Those factors may support demand from international households, executives, medical personnel, university-affiliated workers, and professionals who value location and housing quality.
But affluent does not mean price-insensitive. The city’s median household income is not the income of the tenant who will pay $5,250 or $8,000 every month. Under a conventional 30-percent housing-cost screen, a $5,250 monthly rent requires approximately $210,000 in gross annual household income. Under a three-times-rent screening rule, it requires approximately $189,000.
| Monthly rent | Annual rent | Gross income at 30% housing-cost rule | Gross income at three-times-rent rule |
| $4,500 | $54,000 | $180,000 | $162,000 |
| $5,250 | $63,000 | $210,000 | $189,000 |
| $6,000 | $72,000 | $240,000 | $216,000 |
| $8,000 | $96,000 | $320,000 | $288,000 |
These are screening conventions, not legal requirements. They are nevertheless useful because they expose the size of the tenant pool required by the rent assumption.
The Bureau of Labor Statistics’ May 2025 Miami metropolitan wage release reports a mean hourly wage of $32.30 across occupations in the Miami–Fort Lauderdale–West Palm Beach metropolitan area, compared with $33.54 nationally. At 2,080 hours, that mean implies approximately $67,184 in annual earnings for one full-time worker. Two workers at that mean would earn about $134,368 before taxes, below the $210,000 gross-income threshold for the base rent.
The comparison does not mean that two average workers cannot rent the property. Households have different incomes, assets, bonuses, support, business earnings, and housing priorities. Nor does it mean that the city lacks high earners. It means that the property depends on a narrower tenant segment: a dual-professional household with above-average earnings, a senior manager or executive, an international tenant, a household receiving an employer subsidy, or a tenant temporarily prioritizing a particular location.
That narrower segment can be valuable. It can also be more price-sensitive than a model assumes. A tenant who can afford $5,250 has alternatives. A tenant who can afford $8,000 has more alternatives. The more expensive the rent, the more important it becomes to verify whether the property offers a distinctive enough combination of condition, location, privacy, parking, school access, and convenience to justify the premium.
Michael’s Take has made the broader affordability tension explicit in its analysis of the Miami tourism economy and worker housing. That article concerns a different segment of the housing market, but the transferable lesson is relevant here: aggregate economic activity does not automatically translate into purchasing power for every housing product. A city can be economically attractive while the marginal tenant for a particular house remains constrained.
The city’s rental rule removes an easy revenue escape hatch
A short-term-rental strategy cannot be used as the default solution to weak long-term cash flow. The City of Coral Gables’ August 12, 2026 short-term-rental notice states that, except for designated historic bed-and-breakfast establishments, stays of less than six months are not permitted in areas zoned for single-family or multifamily residential use. The city also says rental agreements in those areas must be at least six months and that noncompliant rentals may face fines and code-enforcement action.
That rule matters for the underwriting, not merely for legal compliance. The analysis cannot responsibly credit daily or weekly rental revenue to a single-family residence without a documented exception. Short-term rentals also bring costs that a simple gross-revenue comparison often omits: furnishing, cleaning, utilities, platform fees, marketing, turnover, local compliance, insurance changes, and higher management intensity.
The property’s Redfin public-record section identifies the zoning as an SFR, or Single-Family Residential District. That is another reason to confirm the official zoning record and the exact address-specific rule before considering any rental strategy outside a six-month-or-longer lease.
Flood and insurance risk is not a footnote in Coral Gables
The model includes $6,000 of annual property insurance as an estimate. It does not include an independently verified quote, a binding landlord policy, a confirmed windstorm premium, a flood policy, or an exact hurricane deductible. Those omissions are material.
The City of Coral Gables’ flood-protection guidance says the city is particularly susceptible to flooding from major rain events and storm surges. It explains that the city lies close to sea level, that underground water is near the surface, and that major rain events can leave water with nowhere to drain in low areas. The city directs owners to flood maps and notes that standard hazard insurance does not cover flood damage.
The city also explains that flood insurance premiums under FEMA’s Risk Rating 2.0 consider factors such as flood frequency, storm surge, heavy rainfall, proximity to water, first-floor height, and rebuilding cost. Those variables make a generic insurance estimate weak evidence. The exact flood zone, elevation information, first-floor height, prior claims, wind coverage, deductibles, roof age, and insurability should be obtained before the buyer treats the expense model as reliable.
Insurance is not necessarily the main reason this deal fails. Even a 20 percent increase in the modeled insurance expense changes monthly cash flow by much less than the core rent-to-price mismatch. But insurance can amplify the loss, reduce liquidity, and create a renewal shock. A property already losing thousands per month is less able to absorb an unexpected premium increase or a major deductible.
Market value and income value are different claims
The public evidence can support a preliminary market-comparison discussion around the $1.25 million to $1.40 million range, subject to condition, renovation quality, legal records, and buyer demand. The prior sale at $1.249 million is the strongest known market anchor in the available record. The current $1.399 million ask may reflect renovation, a changing market, seller expectations, or some combination of those factors.
That is a market-value question. It asks what buyers may pay for the property as a home.
The income-supported value is much lower. At a six-percent target cap rate, the base NOI of $27,593 supports approximately $459,883:
$27,593 NOI ÷ 0.06 = approximately $460,000.
At a five-percent cap rate, the same NOI supports approximately $551,860. At a four-percent cap rate, it supports approximately $689,825. Even the four-percent result is substantially below the asking price.
These figures are not appraisals. They are screening outputs generated by dividing modeled NOI by selected cap rates. A low cap rate can be rational in a high-demand market if investors are accepting lower current income for expected appreciation, scarce land, personal use, or other benefits. But the lower the cap rate, the more the investment depends on assumptions that are outside current rental cash flow.
The asking price could be defensible for a non-rental reason. A buyer may value living in Coral Gables, expect to hold for a long time, prefer a renovated home to a rental property elsewhere, or place a premium on personal use. That is not the same as saying the property is a good leveraged rental investment.
This distinction is central to the analytical approach described by Michael’s Take: follow the pricing structure, cost structure, incentives, and risk rather than accepting a headline valuation as proof of economic value.
Stress testing confirms that the problem is structural
The base case is already deeply negative, so the stress tests do not identify the first moment at which a marginally positive deal fails. They show how an already weak result responds to ordinary setbacks.
| Stress case | NOI | Monthly cash flow before tax | DSCR |
| Base: $5,250 rent and 8% vacancy/credit loss | $27,593 | −$4,681 | 0.33 |
| Rent 10% lower | $22,891 | −$5,073 | 0.27 |
| Vacancy/credit loss at 12% | $25,275 | −$4,874 | 0.30 |
| Vacancy/credit loss at 18% | $21,797 | −$5,164 | 0.26 |
| Operating expenses 10% higher | $24,557 | −$4,934 | 0.29 |
| Insurance 20% higher | $26,393 | −$4,781 | 0.32 |
| Interest rate one percentage point higher | $27,593 | −$5,400 | 0.30 |
| Six months vacant | $3,250 | −$6,710 | 0.04 |
The result is not rescued by self-management. Management fees matter, but eliminating them would not bridge a roughly $56,000 annual gap. Nor is insurance the central variable. The dominant variables are purchase price, rent, and debt service.
This is why describing the risk as “vacancy” is incomplete. Vacancy makes the result worse, but the deal fails even before a severe vacancy event. The larger risk is that the asset’s income stream is structurally too small relative to the acquisition cost.
What would have to change?
There are several ways the conclusion could change, but each requires evidence rather than optimism.
First, rent could be materially higher than the base case. A signed arm’s-length lease around or above the unverified $8,000 figure would require a full model rerun. The lease would need to be genuine, sustainable, and comparable to the proposed ownership period rather than a short-lived promotional outcome.
Second, financing could be materially cheaper. A lower rate reduces debt service, but it would need to reduce it by a very large amount to overcome the gap. A lender’s actual quote, points, reserves, underwriting conditions, and loan structure should replace the assumed seven-percent rate.
Third, the acquisition price could fall substantially. At the stated rent and operating assumptions, the financing-supported zero-cash-flow price is approximately $461,000. That is not a likely offer price or an appraisal. It is a mathematical threshold showing what the property would need to cost for this particular leveraged model to break even.
Fourth, the buyer could pay cash. Cash removes approximately $83,768 of annual debt service, but the property would still produce only about a 1.97 percent base cap rate before income tax and opportunity cost. A cash buyer would therefore be exchanging the mortgage loss for a low current yield.
Fifth, the buyer could be pursuing a non-rental objective. Personal use, expected appreciation, inflation protection, or strategic ownership can matter. They should be underwritten separately from rental return. Combining a personal preference with an investment return can make a purchase feel rational while hiding the cost of the preference.
The due-diligence list is part of the investment thesis
The unresolved items are not administrative details to be handled after the price is agreed. They determine whether the property can legally and economically deliver the assumed income.
Before signing a binding contract, the buyer should obtain and independently review the official Miami-Dade property record, folio, tax bill, assessed value, tax history, and a post-sale tax estimate. The Redfin page shows a 2024 property-tax figure around $9,833 and a 2025 figure around $16,167, while the supplied analysis uses $10,430 from a market-source report. Those figures differ materially. The official tax bill is stronger evidence than a portal estimate, and a post-sale reassessment may change the expense again.
The buyer should also obtain a title commitment, survey, lien search, permit history, certificate-of-occupancy evidence, zoning confirmation, and code-enforcement search. Any renovation claim involving a bedroom, bathroom, roof, windows, electrical work, plumbing, HVAC, addition, or structural change should be matched to permits where required.
A full inspection should address roof, HVAC, structure, electrical, plumbing, mold, termites, drainage, appliances, windows, and unpermitted work. A renovation that is attractive but not properly documented can create financing, insurance, resale, and code risks.
The buyer should obtain binding insurance indications for homeowners, landlord coverage, windstorm, flood where applicable, liability, deductibles, exclusions, and renewal assumptions. A portal’s estimated monthly insurance line is not a substitute for an underwriter’s quote.
Finally, the rental case should be validated with current lease comparables, a realistic marketing period, an arm’s-length rent estimate, and the city’s applicable rental rules. If the intended tenant profile depends on a furnished, executive, or international rental, the model should include the related costs and turnover risk rather than treating the higher rent as pure upside.
Conclusion: desirable address, weak leveraged rental
The evidence supports a medium-low confidence level in the exact numbers but a higher confidence level in the direction of the conclusion. The precise rent, taxes, insurance, condition, financing terms, and legal records remain incomplete. Those uncertainties could move the model. They would have to move a great deal to make a $1.399 million leveraged rental attractive.
At the current asking price, the base case produces approximately $27,593 of NOI against $83,768 of annual debt service. That implies negative cash flow of roughly $4,681 per month before tax, a cap rate near 1.97 percent, negative cash-on-cash return of about 13.2 percent, and DSCR of approximately 0.33. The income-supported price at a six-percent cap is about $460,000, while the market-comparison evidence may place the home near $1.25 million to $1.40 million. The gap between those two concepts is the story.
The informed consideration is therefore to negotiate substantially, pursue a different property with a stronger rent-to-price ratio, or treat this as an owner-occupant purchase rather than a cash-flow investment. That is not a personalized instruction to buy or not buy. It is the conclusion implied by the available underwriting.
What should we learn from this?
A prestigious address can support a high sale price without supporting a high rental yield. Renovation can improve marketability without creating enough rent to carry a large mortgage. A city can be wealthy and internationally connected without giving every single-family home unlimited rent-setting power. And a portal rent estimate can be useful as a lead while remaining too weak to serve as the foundation of a $1.399 million investment.
The practical lesson is to separate three questions before making a decision: What is the property worth as a home? What rent can it actually achieve? What return remains after every operating cost and the buyer’s financing? At 817 Tangier St, the first question may have a defensible answer near the asking range. The second is still uncertain. The third is currently unfavorable.
Financial disclaimer: This article is provided for educational and informational purposes only. It is not financial, investment, tax, legal, career, or other professional advice. The analysis is based on publicly available information believed to be reliable at the time of publication, but data may change and no guarantee is made as to its accuracy or completeness. Readers should conduct their own due diligence and consult a qualified professional before making decisions involving money, employment, contracts, or investments.
Financial Disclaimer: This article is for educational and informational purposes only. It is not financial, investment, tax, legal, real estate, appraisal, or other professional advice. The analysis uses public information and assumptions that may be incomplete or unverified. It is not a recommendation to buy, sell, lease, or finance any property. Conduct independent due diligence and consult qualified professionals before making financial or real estate decisions.
Sources and Methodology
The analysis combines the supplied investment-analysis document dated September 10, 2026 with public listing, government, municipal, and publication sources. The supplied document provides the working underwriting scenarios, comparable-rent summary, financing assumptions, calculated NOI, debt service, sensitivity tests, and unresolved due-diligence items. Public sources were checked for the principal property facts, demographic context, labor-market context, rental restrictions, flood exposure, and relevant Michael’s Take internal links.
1.Public Redfin listing for 817 Tangier St — Supports the current asking price, advertised property characteristics, listing description, sale history, tax-history display, and public-record discrepancies.
2.Public Zillow page for 817 Tangier St — Cross-checks the current asking price, advertised beds and baths, square footage, lot size, year built, and portal valuation display. Portal data is not treated as official tax or ownership evidence.
3.U.S. Census Bureau QuickFacts: Coral Gables city, Florida — Supports population, household, tenure, median home value, median gross rent, income, education, foreign-born, and language figures.
4.U.S. Bureau of Labor Statistics, Occupational Employment and Wages in Miami–Fort Lauderdale–West Palm Beach, May 2025 — Supports metropolitan mean wages and occupation-level wage comparisons.
5.City of Coral Gables, Short-Term Rental Reminder — Supports the six-month minimum for rentals in applicable residential zones, the historic bed-and-breakfast exception, and possible code-enforcement consequences.
6.City of Coral Gables, Flood Protection and Insurance — Supports local flood exposure, flood-map guidance, flood-insurance distinctions, and the importance of elevation and property-specific risk information.
The principal calculations are direct applications of the supplied assumptions: effective income equals gross rent less eight-percent vacancy and credit loss; NOI equals effective income less modeled operating expenses; cash flow before tax equals NOI less annual debt service; cap rate equals NOI divided by purchase price; cash-on-cash return equals annual cash flow divided by modeled initial cash invested; and DSCR equals NOI divided by annual debt service. These are screening calculations, not appraisals, tax opinions, legal conclusions, insurance determinations, or professional investment advice.
Please note: We are not a real estate agency or licensed real estate agent. If you would like to receive additional information or speak with a real estate professional about this property, please complete the form below. An independent real estate agent may contact you directly to provide further assistance.
Property Details
Request Information
Interested in this property? Send an inquiry.
Comments
Loading comments...