






Miami Tourism Economy: $22.7 Billion, Yet Workers Can’t Afford a Two-Bedroom
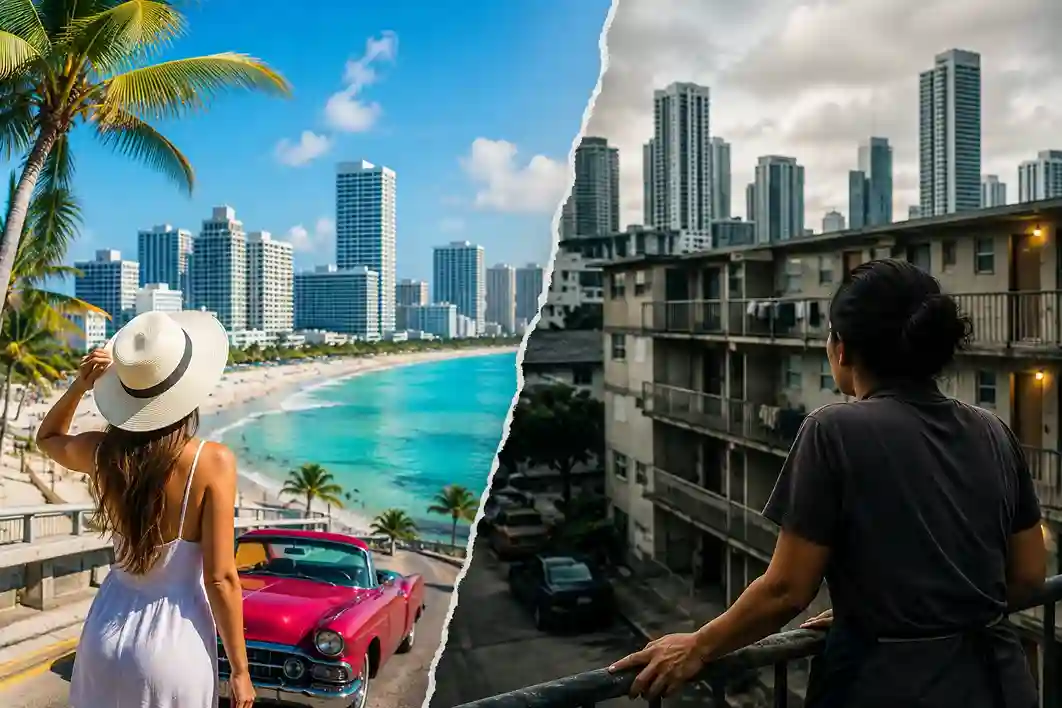
Miami tourism economy generated $22.7 billion in Miami visitor spending in 2025 while supporting more than 216,000 Miami tourism jobs. Yet the most revealing figure in the public record is not the spending total. It is $1,067 the maximum monthly rent the average Miami-Dade hotel and restaurant worker could afford that same year. Set against a two-bedroom Fair Market Rent of $2,329, the numbers expose the central financial tension of one of America’s most successful visitor economies: the money is real, the scale is real, and the distribution is the part rarely examined in official releases.
This is not the story of a single company. Miami tourism has no CEO, no consolidated balance sheet, and no sole owner. It is a distributed financial system assembled over more than a century from railroads, hurricanes, hotel bonds, cruise terminals, airport capacity, convention facilities, immigration, dedicated taxes, and marketing budgets. Understanding where the money actually goes requires treating it as a system of revenues, costs, capital obligations, and unbooked liabilities.
The following analysis follows that money.
Where the Financial Story Really Started: A Railroad, a Land Deal, and a Very Deliberate Illusion
Miami’s tourism economy did not begin with beaches. It began with logistics and land.
According to the City of Miami’s own historical account, Henry Flagler’s railroad reached Miami in April 1896, and the city incorporated three months later with 444 citizens. Flagler didn’t just lay track. He financed streets, water and power systems, drainage canals, and a resort hotel. Julia Tuttle and the Brickell family supplied the land; Flagler supplied the connection and the capital.
That combination is the origin of the entire model, and it is worth naming precisely because it recurs for the next century: infrastructure raises land value, and a manufactured visitor image raises demand for whatever gets built on that land. John Collins and Carl Fisher applied the same formula to Miami Beach with hotels, shops, nightclubs, roads, and relentless promotion.
Here’s what matters financially. The early Miami operators were not primarily in the hospitality business. They were in the land business, using hospitality as the demand driver. Recurring visitor revenue was almost a byproduct of asset appreciation. That is a fundamentally different and far more fragile business model than it looks like from the outside, and Miami found out exactly how fragile in 1926.
The First Crash, and the Lesson That Only Half Stuck
The 1920s boom capitalized expected future demand into land and structures. Then a major hurricane hit in 1926, the national economy turned, and the boom broke.
The response is the interesting part. Miami didn’t abandon tourism; it repriced it. The Greater Miami Convention & Visitors Bureau’s own historical account describes a shift toward a more affordable tourism market during the early Depression years. During World War II, hotels and port facilities were repurposed for military use, which functioned as an economic stabilizer when leisure demand evaporated.
That is a genuinely sophisticated financial maneuver: when demand contracts, change your price positioning and change the use of your assets rather than defending a premium you can no longer sell. Miami has run this play repeatedly, and it is one of the strongest arguments that the destination’s management instincts are better than its reputation suggests.
The half of the lesson that never stuck is the other half. The 1926 collapse demonstrated that real-estate appreciation and tourism economics are not the same thing. Miami would relearn that in 2008.
The Seasonality Fix That Turned Into a Geopolitical Bet
By the 1950s, cheaper and more frequent air travel reshaped the market, and Miami found a solution to the most expensive problem in hospitality: empty rooms in the off-season.
A University of Miami Libraries digital exhibit estimates that roughly 50,000 Cuban tourists visited Miami annually during the 1950s, and argues that this off-peak demand allowed hotels and other establishments to stay open during traditionally slow months. Read that as an operating metric rather than a cultural anecdote. Hotels are fixed-cost businesses. Filling summer capacity from a nearby international market doesn’t just add revenue it converts a seasonal business into a year-round one, which changes financing terms, staffing models, and asset values.
Then the 1959 Cuban Revolution ended that specific flow entirely.
What happened next is the reason Miami’s financial story is more interesting than most destinations’. The lost tourist market was replaced by something structurally larger: migration, capital flight, trade networks, family ties, and hemispheric business. Miami stopped being a vacation town with a Cuban customer segment and became a gateway city. The Census Bureau’s 2025 QuickFacts vintage puts Miami-Dade’s population at 2,802,029, with 54.5% foreign-born for 2020–2024 and 75.3% of residents aged five and over speaking a language other than English at home. Those aren’t tourism statistics. They’re the explanation for why the tourism product works.
The financial lesson is uncomfortable but real: a concentrated demand source can vanish overnight, and the destinations that survive are the ones whose adjacent assets language, networks, trade, culture can be monetized differently.
How the Income Machine Changed: Four Engines Instead of One
By the 1990s, Miami had stopped selling one thing. The modern Miami tourism economy runs on at least four distinct revenue engines, and they capture money in completely different ways.
Leisure tourism supplies volume and brand visibility. International visitors the GMCVB named Colombia, Brazil, the United Kingdom, Canada, Mexico, Argentina, Spain, Italy, Germany, and France among leading source markets in 2025 supply higher spending and reduce dependence on any single domestic demand cycle. Cruise tourism supplies a specialized homeport position with pre- and post-cruise hotel nights, meals, and transport attached. Meetings, conventions, sports, art, and food events supply weekday and shoulder-season demand that leisure travel structurally cannot.
The same principle applies to major sporting events: a city can generate enormous visitor spending and headline economic impact without every dollar becoming profit for the league, the broadcaster, local businesses, or taxpayers. Super Bowl LX Revenue: The Real Economic Impact examines who actually captures the money—and who carries the cost.
Each engine also carries a different risk. International demand is exposed to currency, visas, airline capacity, and politics abroad. Cruise depends on the strategic decisions of a small number of very large operators. Conventions depend on corporate travel budgets and on continuously reinvesting in the venue. Leisure depends on weather, safety, and price.
Diversification here is not decoration. It is the reason Miami’s revenue base survived shocks that flattened single-engine destinations.
Following the $22.7 Billion: What Miami Visitor Spending Actually Buys
Now the headline figures, handled carefully.
For 2025, the GMCVB reported 28.3 million visitors, $22.7 billion in visitor spending (up 4.1% from 2024), more than 216,000 tourism-supported jobs, more than $12 billion in hospitality-sector wages, $32.2 billion in total economic impact, more than $5.3 billion in combined federal, state, and local tax revenues, and roughly 8% of Miami-Dade County GDP. Lodging alone accounted for $10.4 billion.
Divide $22.7 billion by 28.3 million and you get roughly $803 of spending per visitor. That is a derived calculation from two rounded inputs, and it is emphatically not an average hotel bill or a per-night figure the visitor count mixes day-trippers, overnight guests, cruise passengers, and business travelers with wildly different spending profiles. But as a directional number it’s useful, because it reframes the debate. A destination arguing about visitor volume is arguing about the wrong variable. The variable that matters is that $803, and whether it can be moved up without adding another body to the beach.
Lodging’s $10.4 billion works out to about 45.8% of total visitor spending. That single fact explains an enormous amount about how Miami is governed. Hotels are the chokepoint where visitor money is easiest to measure, easiest to tax, and easiest to organize politically. Restaurants, retail, transport, attractions, and events capture the rest, but they’re fragmented, harder to tax at the point of sale, and much harder to speak for.
And here is the part that gets skipped: none of these figures are profit. Visitor spending is gross flow. Out of it come wages, rent, insurance, property taxes, debt service, utilities, food costs, distribution fees to booking platforms, and marketing. “Economic impact” of $32.2 billion is a modeled number that includes indirect and induced effects. Treating it as though it were revenue, let alone earnings, is the most common analytical error made about tourism economies anywhere.
The Tax Machine: Visitors Fund the Machine That Attracts Visitors
This is where the Miami tourism economy becomes genuinely clever and also where it becomes self-reinforcing in a way that deserves scrutiny.
Miami-Dade County’s official guidance states that short-term transient rentals carry a 6% local convention-and-tourist tax on top of Florida’s 6% sales tax, with geographic exceptions for jurisdictions including Miami Beach, Bal Harbour, and Surfside. The local 6% breaks down into a 3% Convention Development Tax, a 2% Tourist Development Tax, and a 1% Professional Sports Facilities Franchise Tax. Tourist Development Tax proceeds are allocated among the GMCVB, cultural affairs, and facilities in the City of Miami. Convention Development Tax receipts support convention centers, cultural facilities, and debt service.
Appendix M of the FY 2026–27 proposed county budget reports FY 2024–25 actual collections of $48.601 million from the 2% Tourist Development Tax, $127.555 million from the 3% Convention Development Tax, and $24.300 million from the 1% sports franchise tax. Add only those three and you get $200.456 million. The same appendix separately reports $11.263 million from a 2% hotel food-and-beverage surtax and $52.153 million from a 1% homeless and domestic-violence tax.
Those categories should never be casually summed and described as “tourism money available to spend.” They have different bases, different geographies, and legally restricted uses. But the architecture is unmistakable: visitors are taxed to pay for the marketing and infrastructure that bring more visitors, who are taxed again.
The alignment is genuinely elegant. Beneficiaries pay. Residents don’t fund the promotional budget out of general revenue. Sports debt and cultural programming get a dedicated stream.
The risk is circularity. When dedicated taxes fund more promotion and more capacity, and the resulting growth becomes the justification for further investment, the system acquires a political and financial commitment to expansion that can outlive the point at which marginal returns are still attractive. Nothing in the public record reviewed shows a mechanism designed to say “enough capacity.”
The Concrete Bets: A Port, a Convention Center, and an 800-Room Hotel
The most capital-intensive decisions in this story are the ones made in concrete.
PortMiami is publicly owned and reports more than $1 billion in capital improvements, including the Port Tunnel and the Deep Dredge Project. Its stated mission includes remaining financially self-sufficient. A Martin Associates study commissioned by the port and announced by Miami-Dade County in May 2024 estimated 2023 total economic activity of $61.4 billion, $2.2 billion in state and local taxes, and 340,078 supported jobs, built from tenant and service-provider interviews plus passenger and crew surveys.
Compare that to the same study’s 2016 figure of $41.4 billion, and total activity rose about 48.3% in nominal terms roughly $20 billion. But supported jobs went from 334,500 to 340,078, an increase of about 1.7%. Activity grew nearly thirty times faster than employment. That gap could reflect higher productivity, higher prices, a changed activity mix, or methodological differences between study rounds. The press release doesn’t permit a definitive answer. What it does establish is that “economic impact” and “jobs” are moving on very different curves, and only one of those curves shows up in most headlines.
One more caution on the port: its own web pages have stated both more than $61 billion and $42 billion in annual contribution in different sections. That’s a documentation-quality problem, not something to resolve by averaging. The dated 2024 release with disclosed methodology is the stronger source.
Then there’s Miami Beach. The Miami Beach Convention Center underwent a $640 million renovation and expansion from 2015 to 2020, producing 1.4 million square feet of event space, a 60,000-square-foot ballroom, breakout rooms, and public green space. The facility is owned by the City of Miami Beach and operated by Oak View Group. For FY 2025 it reported more than 537,000 guests across 143 events spanning medical, finance, fintech, education, sports, arts, and corporate categories.
The timing was brutal. A project approved in the mid-2010s opened directly into a pandemic that shut down global business travel. That doesn’t make the decision wrong but it is the cleanest available illustration of why tourism capital projects need to be underwritten against interruption rather than against a base-case demand forecast.
The bet is now being doubled. An 800-room Grand Hyatt, connected to the convention center, broke ground on May 16, 2025, with the center’s reporting citing $392 million in construction financing secured. Public materials point to a 2027 opening. The logic is sound on paper: large conventions need connected room blocks, and Miami Beach has been losing bids without one.
Can you calculate the return? Not from public records. Divide the $640 million renovation by FY 2025’s 537,000 guests and you get about $1,192 per guest a number that looks damning and means almost nothing, because a capital asset serves decades, guests attend different events with different values, and the renovation created public-space and technology benefits that don’t attach to a turnstile count. The honest finding is that no complete, independently audited public return-on-investment analysis for these projects appears in the record. The absence of a calculation is not proof of failure. It is proof that the question hasn’t been answered publicly.
Miami Tourism Jobs: The Number That Looks Best From Farthest Away
Here is where the Miami tourism economy’s accounting and its lived reality separate most sharply.
More than 216,000 tourism jobs and more than $12 billion in hospitality wages is a serious employment platform roughly 10% of county employment by the GMCVB’s count. But average wage tells a different story than aggregate wage.
The Bureau of Labor Statistics reported that for May 2025, food-preparation and serving occupations made up 9.9% of Miami-area employment at an average of $18.44 per hour, with building and grounds cleaning and maintenance averaging $18.23. The University of Florida’s Shimberg Center reported a 2024 accommodation-and-food-services average of $20.52 per hour, or $42,685 annually. Against that income, the maximum affordable rent works out to $1,067 per month, while the 2025 two-bedroom HUD Fair Market Rent was $2,329 meaning roughly 65% of that worker’s income would go to a two-bedroom rental.
The broader housing picture is consistent. Miami-Dade’s 2024 median gross rent was reported at $2,050, and the Shimberg Center estimated 171,107 renter households paying 50% or more of income toward gross rent.
None of this proves every hospitality worker is struggling; tips, dual incomes, shared housing, and management roles all change individual outcomes. But as a structural matter, the destination’s service quality depends on labor it cannot house nearby at the wages it pays. That cost doesn’t disappear it gets transferred to workers as commute time, crowding, and housing stress, and it comes back to employers as turnover, recruitment difficulty, and pressure toward automation or higher prices.
Put bluntly: workforce housing is not a social program adjacent to the tourism economy. It’s deferred maintenance on the tourism economy’s most important operating input.
The Gateway Numbers Nobody Puts on a Billboard
The chart accompanying this analysis tells the recovery story in two lines, drawn from the GMCVB’s published January–June cumulative series.
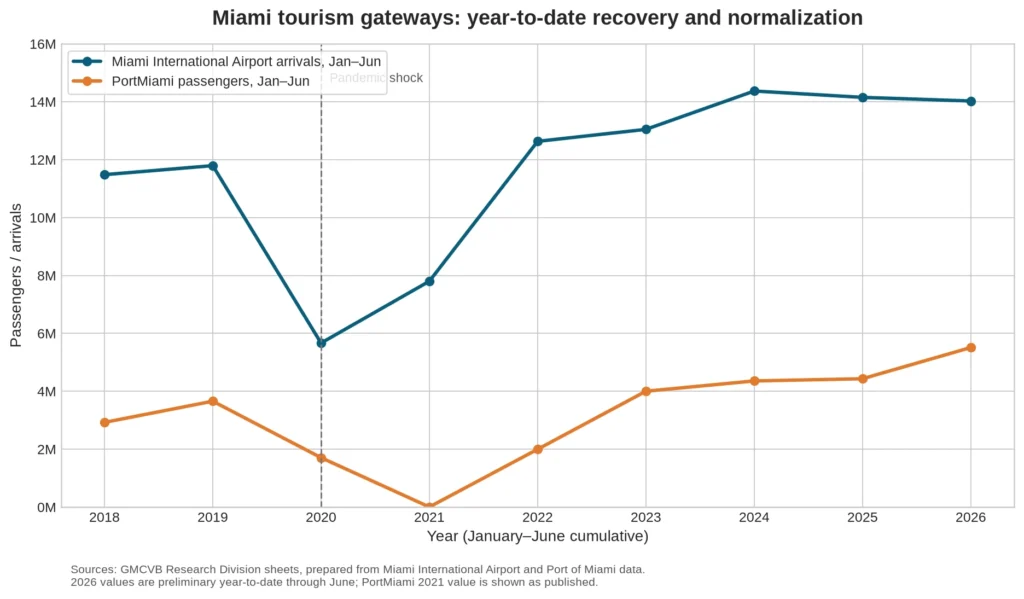
Miami International Airport arrivals ran 11.481 million in the first half of 2018 and 11.793 million in 2019, collapsed to 5.666 million in 2020 a decline of roughly 52.0% and reached 14.025 million by January–June 2026, about 18.9% above the 2019 baseline.
PortMiami’s published series went from 2.925 million passengers in the first half of 2018 to 3.657 million in 2019, fell to 1.707 million in 2020 (down about 53.3%), and reached 5.510 million by January–June 2026 roughly 50.7% above 2019. The 2021 entry in that series is shown as published and is anomalously low; it should be read as an operational record rather than quietly corrected.
Two things jump out. First, the port has outgrown the airport by a wide margin: about 50.7% above pre-pandemic versus about 18.9%. Miami’s cruise specialization isn’t just holding it’s the fastest-growing gateway in the system.
Second, and less comfortable, MIA’s first-half arrivals have now declined three years running: 14.370 million in 2024, 14.151 million in 2025, 14.025 million in 2026, with international arrivals slightly up year over year and domestic arrivals down. That is normalization, not collapse. But it is not the shape of a line that supports “record year” framing without qualification.
Hotel performance says something similar. The GMCVB’s June 2026 sheet shows Miami-Dade year-to-date occupancy at 77.5%, down 1.3% year over year, while ADR rose 12.7% to $283.32 and RevPAR rose 11.3% to $219.44.
Rates up sharply, occupancy slightly down, revenue per available room up strongly. That is a destination exercising pricing power. It could mean a richer visitor mix, constrained supply, deliberate yield management, or operators passing through higher insurance and labor costs. The public data cannot distinguish among those explanations and the difference matters enormously, because three of those four are strength and one is a squeeze being handed to the customer.
Where the Numbers Contradict Each Other
An honest accounting has to include the places where the official record disagrees with itself.
The GMCVB’s 2024 release reported more than $31 billion in economic impact and 9% of county GDP. The 2025 release reported $32.2 billion and about 8%. The numerator rose while the reported share fell. The most likely explanation is a changed GDP denominator, a different data vintage, methodology, or rounding not an actual decline in tourism’s economic role. But it should be disclosed rather than smoothed into a trend line, and it illustrates why comparing destination impact figures across years is riskier than it looks.
Similarly, “tourism-supported jobs,” “jobs supported by port activity,” “visitor spending,” and “total economic impact” are four different concepts routinely used as if they were one. A supported job may be direct employment, supplier demand, induced household spending, or a modeled multiplier. Taxes collected from visitors are public revenue, not net fiscal benefit after the public services and capital costs that visitors also consume.
The Bill That Hasn’t Come Due
Every asset in this system sits at sea level.
Miami-Dade County’s own resilience materials project 10 to 17 inches of sea-level rise by 2040 relative to 2000. NOAA’s National Centers for Environmental Information counts 94 billion-dollar weather and climate disasters affecting Florida from 1980 through 2024, including 36 tropical cyclones. The county cites modeled adaptation returns of about $9 per $1 for certain building-level measures and $5 per $1 for community-wide measures decision-useful estimates, but modeled, not realized.
The financial framing here is straightforward and rarely stated: Miami is continuing to add high-value, geographically exposed tourism assets while the cost of protecting them rises. Insurance markets, construction costs, and maintenance obligations all move against the destination over time. Present growth is booked immediately; adaptation liability accrues quietly.
That’s the most significant unpriced item on the destination’s implied balance sheet.
The Turning Points That Changed the Money
Strip the story to the decisions that actually redirected cash flows and you get a short list.
1896 established the model when Flagler’s railroad converted a settlement of 444 people into a connected platform where land, utilities, and hospitality reinforced one another. 1926 broke it, proving that capitalized expectations reverse violently and forcing a repricing toward affordable tourism that preserved the industry through the Depression. The 1950s solved seasonality through Cuban off-peak demand, improving fixed-asset utilization until 1959 removed that market and replaced it with something larger and more durable: hemispheric migration, trade, and gateway status.
The 1990s through 2007 built the multi-engine system, adding cruise scale, air connectivity, convention capacity, and luxury lodging, while also increasing capital exposure. Then 2008–2010 delivered the second great lesson: HUD’s analysis reports Miami-Dade nonfarm payrolls fell by an average of 26,800 jobs annually across those three years, with 57,900 lost in 2009, driven by construction and professional services while leisure and hospitality was among the few sectors that still gained. Tourism cushioned the fall. It did not prevent it. Diversification within tourism is not the same as economic diversification.
Recovery from 2011 to 2017 saw payrolls grow about 2.5% annually, outpacing the nation, with PortMiami handling 5.3 million cruise passengers in 2017 and Royal Caribbean investing $250 million in a new terminal. The $640 million convention center rebuild completed in 2020, immediately into the pandemic shock. And now, 2025 through 2027 marks the shift from recovery into deliberate capacity expansion: record visitor and spending figures, the Grand Hyatt under construction, and a growing set of housing, resilience, and capital obligations attached to it.
What the Public Story Doesn’t Explain
The public story is 28.3 million visitors and $32.2 billion in impact. The financial story is harder and more interesting.
Miami has proven, across more than a century and multiple catastrophes, that it can generate demand. That question is settled. What remains genuinely open is whether the destination can convert that demand into broadly distributed, durable local value and whether it can measure whether it’s doing so.
Nowhere in the public record reviewed is there a complete incidence analysis tracing who pays the visitor taxes, who receives the spending, who absorbs congestion and housing costs, and how those benefits and costs differ by neighborhood, income, tenure, and occupation. The GMCVB reports resident benefits and household savings from tax revenues. Those are institutional claims, reasonable on their face, but not independently verified distributional findings.
That gap is the real vulnerability. Not demand. Legitimacy.
What the Miami Tourism Economy Teaches About Money
A few lessons transfer well beyond South Florida.
Gross flow is not profit, and impact is not return. A $22.7 billion spending figure tells you the size of the pipe, not how much water reaches your yard. Anyone evaluating a business, a city, or an investment should insist on knowing which of those they’re being shown.
Fixed-cost businesses live and die on utilization. Miami’s most underrated financial move wasn’t a marketing campaign it was finding an off-peak market in the 1950s. Occupancy in slow months is worth more than headline visitor counts in peak season.
Asset appreciation is not operating income. Miami learned this in 1926 and again in 2008 and has never fully internalized it. A model that depends on rising asset values instead of recurring revenue is a model waiting for a reversal.
Concentrated demand can vanish, but adjacent assets can be re-monetized. Losing the Cuban tourist market cost Miami a customer base and gave it a global identity. Optionality has value precisely when the base case fails.
Your workforce is infrastructure. When the people who deliver your product can’t afford to live near it, you are running an unfunded liability disguised as a labor cost.
And finally: measure what you actually want. A destination that optimizes for visitor volume gets volume plus crowding, housing pressure, infrastructure wear, and eventual resident backlash. A destination that optimizes for value per visitor, length of stay, shoulder-season occupancy, wage progression, and net fiscal contribution has to work harder and report more honestly, but it’s building something that compounds.
Miami has already answered the hard question about whether people will come. The next twenty years will answer the harder one: whether the money they bring stays worth having.
Financial Disclaimer: This article is provided for informational and educational purposes only. It is based on publicly available information and the cited sources listed below, and it does not constitute financial, investment, legal, tax, or accounting advice. Figures described as estimates, modeled results, or derived calculations should not be treated as verified outcomes. Nothing here should be relied upon as a recommendation to buy, sell, invest, or make any financial decision. Readers should consult a qualified professional regarding their own circumstances.
Sources
- Greater Miami Convention & Visitors Bureau, “GMCVB Reports Strong Tourism Performance, Positioning Miami-Dade County for Continued Growth,” June 3, 2026 — https://www.miamiandbeaches.com/press-and-media/miami-press-releases/gmcvb-reports-strong-tourism
- PR Newswire, “Greater Miami Convention & Visitors Bureau Reports Strong Tourism Performance,” June 2026 — https://www.prnewswire.com/news-releases/greater-miami-convention–visitors-bureau-reports-strong-tourism-performance-positioning-miami-dade-county-for-continued-growth-302791987.html
- Greater Miami Convention & Visitors Bureau, “Miami-Dade Tourism Remains Robust With Record Number of Visitors in 2024,” May 29, 2025
- GMCVB Research Division, “Miami International Airport Passenger Arrivals, 2018–2026”
- GMCVB Research Division, “PortMiami Monthly Passenger Count, 2018–2026,” July 16, 2026
- GMCVB / STR, “Miami-Dade Occupancy, Room Rate and RevPAR by Region, June 2026”
- Greater Miami Convention & Visitors Bureau, “Miami’s History & Heritage,” June 20, 2024
- Miami-Dade County, “PortMiami’s 2023 Economic Impact Tops $61 Billion,” May 17, 2024 — https://www.miamidade.gov/global/release.page?Mduid_release=rel1715952722118863
- Miami-Dade County, “About PortMiami”
- Miami-Dade County, “Tourist and Restaurant Taxes”
- Miami-Dade County, “Appendix M: Transient Lodging and Food and Beverage Taxes,” FY 2026–27 Proposed Budget
- Miami-Dade County, “FY 2024–25 Adopted Budget and Multi-Year Capital Plan”
- Miami-Dade County, “Sea Level Rise and Flooding” and “Sea Level Rise Strategy”
- Miami Beach Convention Center, “Miami Beach Convention Center Wraps a Milestone Year 2025,” December 18, 2025 — https://www.miamibeachconvention.com/center-info/press/mbcc-wraps-milestone-year-2025
- Miami Beach Convention Center, “Grand Hyatt Miami Beach — MBCC Headquarter Hotel” — https://www.miamibeachconvention.com/center-info/grand-hyatt-miami-beach
- Miami Beach Convention Center, “Venue & Campus Improvements and Innovation Projects” — https://www.miamibeachconvention.com/center-info/capital-improvements-and-innovation
- U.S. Bureau of Labor Statistics, “Occupational Employment and Wages in Miami–Fort Lauderdale–West Palm Beach, FL — May 2025,” July 7, 2026
- U.S. Census Bureau, “QuickFacts: Miami-Dade County, Florida” (2025 vintage)
- U.S. Department of Housing and Urban Development, “Miami–Miami Beach–Kendall, Florida Comprehensive Housing Market Analysis as of March 1, 2019”
- Shimberg Center for Housing Studies, University of Florida, “Results: Affordability”
- NOAA National Centers for Environmental Information, “Billion-Dollar Weather and Climate Disasters: Florida Summary”
- City of Miami, “History of the City of Miami” (archived official website)
- University of Miami Libraries, “Development of Tourist Sites: Travel, Tourism and Urban Growth in Miami”
- South Florida Business Journal, “2025 Miami-Dade tourism: 28 million visitors, $32 billion impact,” June 5, 2026 — https://www.bizjournals.com/southflorida/news/2026/06/05/miami-dade-tourism-hits-record-32-billion-dollars.html
- Christian Science Monitor, “Miami: a magnet for adventure and profits,” May 7, 1987




Comments
Loading comments...