






Super Bowl LX Revenue: The Real Economic Impact
Super Bowl LX revenue set an advertising record that its own broadcaster refused to quantify. The Super Bowl economic impact claimed for the Bay Area reached roughly $720 million, yet the honest answer to who made money from the Super Bowl is far narrower than either headline suggests.
Here is the strange part: in the same quarter that NBCUniversal booked the highest-grossing Super Bowl ad sales in history, its parent company reported that the media division swung to an adjusted EBITDA loss. Record revenue. Negative operating profit. Same three months.
That single contradiction is the reason this investigation exists.
Introduction: The Event Everyone Measures and Nobody Audits
Super Bowl LX was played on February 8, 2026, at Levi’s Stadium in Santa Clara, California. The Seattle Seahawks beat the New England Patriots 29 to 13, and Kenneth Walker III was named Most Valuable Player. Announced attendance was 70,823.
Those are the last simple facts in this story.
Everything downstream of the final whistle becomes a numbers fight: an audience estimate that was revised upward two days after the game, an advertising record with no disclosed total, a ticket market where the official face value and the actual clearing price differed by a factor of five, a merchandise operation that announced percentage growth while withholding every dollar figure, and a regional economic impact estimate that grew from a pre-event projection of $370 million to $630 million into a post-event claim of approximately $720 million.
The core discipline of this piece is simple. Revenue is not profit. Attendance is not profitability. Modeled economic impact is not money in anyone’s bank account. And a sold-out ad break is not proof that the advertisers who filled it earned anything back.
What Super Bowl LX Was Supposed to Make
Expectations were set publicly and in stages, which is useful, because it lets us grade the forecasts against the outcomes.
On the host side, the Bay Area Host Committee published a June 2024 pre-event study projecting a regional economic impact of $370 million to $630 million, roughly $300 million in labor income, about $16 million in local government fiscal revenue, and around 5,000 jobs, driven by more than 90,000 out-of-region visitors. Separately, the California governor’s office projected in early February 2026 that the Bay Area would see approximately $555 million in impact and 260,000 out-of-town visitors, a visitor figure nearly three times the host committee’s own assumption. Two official-sounding projections, published days apart, disagreed by 170,000 people. That should have been the first warning that “economic impact” is a genre, not a measurement.
On the media side, NBCUniversal reportedly went to market seeking at least $7 million per 30-second in-game unit and sold out its inventory in September 2025, days before the season even started. That is not a normal sell-out. That is a broadcaster pricing four years of scarcity into one Sunday, because under the current rights structure each network only gets the game once per cycle.
On the consumer side, the National Retail Federation and Prosper Insights projected record total spending of $20.2 billion on food, drinks, apparel, decorations, and related purchases, or $94.77 per person, up 8.6 percent year over year, based on a survey of 7,791 adults conducted January 2 to 8, 2026, with a margin of error of plus or minus 1.1 percentage points.
Note what that $20.2 billion is not. It is not NFL revenue. It is not ticket revenue. It is a survey-based projection of what American consumers said they intended to spend, most of it at grocery stores and pizza chains that have nothing to do with the league’s balance sheet.
Where the Money Came From
Reconstructing Super Bowl economics means separating at least six distinct money pools that are routinely, and lazily, added together in press coverage:
The first is national media rights, paid by networks to the NFL under long-term contracts. The second is advertising, paid by brands to the broadcaster, not to the NFL. The third is ticketing and hospitality, controlled by the league and its official hospitality provider. The fourth is merchandise and licensing, run by contracted operators. The fifth is host-region visitor spending, captured overwhelmingly by hotels, restaurants, airlines, and rideshare companies. The sixth is ancillary consumer activity, including a record $1.76 billion in legal sports wagers estimated by the American Gaming Association, up nearly 27 percent year over year, which flows to sportsbooks and state tax authorities rather than to the NFL.
Only pools one, three, and part of four land meaningfully in league accounts. That distinction does most of the analytical work in this article.
Ticket Revenue: The First Big Number, and the First Big Illusion
Here is a fact that surprises most fans: there is no general public on-sale for the Super Bowl. The NFL accounts for every single ticket and distributes them by formula.
For Super Bowl LX, the allocation reportedly ran as follows: 25.2 percent to the league office, 17.5 percent each to the Seahawks and Patriots, 5 percent to the host San Francisco 49ers, and 1.2 percent to each of the other 29 clubs. Of the league’s own block, roughly 2,500 seats went to the league office, about 750 to the host committee, and roughly 10,000 to On Location, the NFL’s official hospitality provider, which is owned by TKO Group Holdings.
Official face value ranged from $950 to $8,500. The resale market lived in a different universe. Get-in prices sat around $6,500 immediately after the conference championships, then fell nearly 30 percent to roughly $4,600 as fresh inventory hit the market, with some platforms showing pairs in the $3,750 to $4,000 per-seat range in the final stretch. Average asking prices were reported around $8,000 in late January. On Location’s own bundles were reported at $6,500 per person at one point, down from $7,500 a week earlier, while all-inclusive travel packages with hotel stays, Napa Valley tastings, or Pebble Beach tee times started around $13,600 per person.
So what did the gate actually generate?
Economist Andrew Zimbalist estimated to CNBC that the NFL would take in close to $400 million from tickets and luxury boxes alone. Treat that as a reported estimate from a credible outside expert, not an audited figure. Against announced attendance of 70,823, that implies roughly $5,650 per attendee, which only makes sense if suites, premium inventory, and hospitality packages are folded in alongside standard seats.
A more conservative reconstruction using face value only: if the average face value across all 70,823 seats landed at $2,000, gate revenue would be about $142 million. At $3,000 average, about $212 million. At $5,000 average, about $354 million. The true figure is not public. What we can say with confidence is that face-value ticket revenue is a mid-nine-figure line item at most, and that the enormous gap between the $950 floor and the $6,500 resale floor represents value captured almost entirely by resellers, brokers, and package sellers rather than by the league.
That gap is the single most underappreciated fact in Super Bowl consumer economics. The NFL sets the price low enough that a season-ticket-holder lottery winner can attend. The secondary market then reprices the ticket at market clearing, and the league does not capture that spread on those seats.
Sponsorship and Advertising Money: A Record With No Number
This is where Super Bowl LX made its real money, and where the reporting gets deliberately vague.
NBCUniversal sold out its Super Bowl LX inventory in September 2025. Ad chief Mark Marshall said the average 30-second in-game unit went for about $8 million and confirmed that a handful of units cleared $10 million or more, the first time any broadcaster had hit that threshold. He also noted that nearly 40 percent of advertisers were new to the Super Bowl, with particular demand from technology companies, and that NBCU deliberately did not expand inventory despite the demand.
After the game, NBCU announced it had achieved the highest-grossing ad sales in Super Bowl history, surpassing the previous record held by Fox, which reported more than $800 million across Fox and Tubi for Super Bowl LIX. NBCU declined to release the final figure.
We can, however, triangulate. Comcast’s first quarter 2026 results showed domestic advertising revenue in the media unit up 135 percent to $3.45 billion, and stated that excluding the Super Bowl and the Winter Olympics, that line rose 4.7 percent to $1.54 billion. Simple subtraction puts the combined Super Bowl and Milan Cortina Olympics advertising contribution at roughly $1.91 billion for the quarter. The Super Bowl is one day; the Olympics ran more than two weeks. Splitting that pool is not possible from public disclosure, but a Super Bowl figure at or somewhat above Fox’s $800 million benchmark is consistent with both the company’s own record claim and the arithmetic.
Now the useful metric. Dividing an $8 million to $10 million 30-second price by Nielsen’s 125.603 million average viewers gives a cost of roughly $63.69 to $79.62 per thousand average viewers. That is a pricing-context number and nothing more. It excludes creative production, which industry reporting places in the $1 million to $4 million range before talent, celebrity fees, agency costs, media amplification, and in-store activation. Multiple analyses put the realistic all-in cost of a serious Super Bowl campaign in the $15 million to $29 million range once everything is counted.
Run the break-even on that. A brand spending $20 million all-in, operating at a 40 percent gross margin, needs roughly $50 million in incremental revenue attributable to the campaign just to get back to zero. Not total revenue during the period. Incremental, attributable revenue. Very few brands publish that analysis, and the ones that do rarely publish it when it goes badly.
One more sponsorship line that is often missed: Apple reportedly pays the NFL close to $50 million annually to be the presenting sponsor of the halftime show. That is league revenue, not broadcaster revenue, and it is one of the cleanest examples of the NFL monetizing an asset it does not have to produce content for.
Broadcasting and Media Rights: The Real Engine
The NFL’s media agreements with Amazon, CBS, ESPN and ABC, Fox, and NBC run through the 2033 season and are collectively valued at more than $110 billion over eleven years. NBCUniversal’s package alone is reported at approximately $2 billion per year.
Under the rotation, CBS, Fox, and NBC each carry three Super Bowls and ESPN and ABC carry two. It is worth correcting a common misreading here: the rotation is stated by season, not by calendar year of the game. The 2025 season Super Bowl, which is Super Bowl LX in February 2026, belonged to NBC. ESPN and ABC hold the 2026 and 2030 season games, meaning Super Bowl LXI in February 2027 and Super Bowl LXV in February 2031. Getting this wrong is easy and it materially changes who is on the hook for which year’s economics.
Here is the punchline of the rights structure. If NBC’s annual NFL rights cost is roughly $2 billion and its Super Bowl advertising haul is somewhere north of $800 million, then a single Sunday recovers something on the order of 40 percent of an entire year’s rights fee. That is why networks tolerate the rest of the deal. The Super Bowl is not a game inside a rights package. It is the collateral that makes the rights package financeable.
At the other end of the live-sports spectrum, Netflix’s smaller MLB package shows how a streaming platform can test acquisition, advertising and audience value through a limited slate of marquee events rather than a full-season rights commitment. The strategic logic is similar; the financial exposure is not.
For NBCUniversal, however, that strategic logic still came with a high cost. Comcast’s media segment posted revenue up nearly 61 percent to $7.28 billion in the first quarter of 2026, and simultaneously reported an adjusted EBITDA loss of roughly $426 million, driven by the costs of the Winter Olympics, the Super Bowl, and NBA rights. Peacock added subscribers to reach 46 million and nearly doubled revenue to $2.1 billion, while posting a quarterly loss of $432 million.
Record Super Bowl ad revenue coexisted with a loss-making quarter for the division that sold it. If you take one receipt from this entire article, take that one.
Merchandise, Food, and Other Revenue: Percentages Without Dollars
Legends Global, which ran Super Bowl LX merchandise across Levi’s Stadium, the Super Bowl Experience at Moscone Center, hotels, storefronts, and pop-ups, announced record-breaking sales. Overall merchandise was up 22 percent over Super Bowl LIX in New Orleans and 12 percent above the prior record set at Super Bowl LVIII in Las Vegas. Average transaction value rose 9 percent. Merchandise per capita set a new non-pandemic record, up 16 percent over the previous high from Super Bowl LVI. Game-day sales inside Levi’s Stadium rose 26 percent year over year. The operation ran 11 in-stadium locations, five portables outside, a 27,000 square foot NFL Shop open seven days with 830 styles from more than 35 licensees, and more than 350 staff.
Every one of those numbers is a percentage. Not one is a dollar. That is a deliberate disclosure choice, and it is standard practice across live-event retail. It tells us demand was strong. It tells us nothing about gross margin after manufacturing, licensing royalties, freight, staffing, unsold inventory, and the revenue share among the NFL, the operator, and the venue.
Food, beverage, parking, and concessions figures for Super Bowl LX were not publicly disclosed in the records reviewed. In normal NFL operations, home teams keep concession and parking revenue, but the Super Bowl is a league-operated event and the standard club economics do not apply cleanly. Any per-attendee concession estimate here would be invented, so none is offered.
On hospitality, we do get one revealing public data point. On Location sits inside TKO’s IMG segment. In the first quarter of 2026, IMG segment revenue rose 38 percent to $655.4 million, with a $179.2 million increase in live events and hospitality that TKO attributed primarily to the Milan Cortina Olympics, not the Super Bowl. More instructive still: IMG’s adjusted EBITDA margin was 15 percent, against 63 percent at UFC and 54 percent at WWE.
Premium hospitality is a large-revenue, thin-margin business. Selling a $13,600 package with four nights at a resort, transportation, catering, and golf is not the same as selling a media right. The cost of goods is enormous.
What Super Bowl LX Actually Cost
Public cost disclosure is patchy, but the host side gives us the clearest window.
Santa Clara estimated its costs at roughly $6.3 million to $6.4 million, with the largest components being about $2.7 million for event staffing, $1.4 million for vendors, and $572,636 for police planning and preparation. Under the final funding agreement, the Bay Area Host Committee agreed to reimburse those costs, plus about $650,000 in Santa Clara Convention Center rent, with the 49ers stadium company as backstop. City staff said the structure gave Santa Clara more protection than the 2016 arrangement.
That vote was not unanimous. The Stadium Authority board approved it 5 to 2, with Mayor Lisa Gillmor and Vice Mayor Kelly Cox voting no. Gillmor wanted a letter of credit or comparable guarantee, arguing that a host committee approval requirement on each reimbursement created risk for taxpayers. The 49ers’ general counsel said no such instrument was necessary and that the city would incur no general fund cost.
This is the most honest cost conversation in the entire Super Bowl LX record, and it took place in a city council chamber rather than a press release. The context matters: Santa Clara had previously settled a public safety cost dispute with the 49ers that resulted in $20 million to the city over two years.
Divide the roughly $6.4 million in reimbursed city costs by 70,823 attendees and you get about $90 per person in municipal service cost for one host city alone. San Francisco, which hosted the Super Bowl Experience and the bulk of the week’s activity roughly 40 miles from the stadium, carried its own public safety and services burden that was not separately itemized in the sources reviewed.
Other costs are structurally invisible. The NFL covers halftime show production, which industry reporting has placed in the $10 million to $20 million range in recent years, while paying performers only union scale. Bad Bunny, whose halftime performance averaged 128.2 million viewers, was not paid a performance fee in the conventional sense. The compensation is exposure, and it is real: Apple reported more than 63 million views across related halftime content.
Player compensation is fixed by the collective bargaining agreement: $178,000 per player on the winning roster and $103,000 per player on the losing roster, each up $7,000 from the prior year. Against a game generating hundreds of millions in same-day commercial value, total player Super Bowl bonuses across both rosters come to roughly $15 million. The athletes are, in strict accounting terms, one of the smaller line items.
Who Got Paid
Rank the beneficiaries by clarity of evidence rather than by volume of press release.
The NFL is the clearest winner. It collects the media rights fees, controls and distributes every ticket, receives halftime sponsorship money reported at close to $50 million a year from Apple, and licenses the merchandise. League-wide revenue has been reported above $23 billion, with national revenue distributions exceeding $450 million per club. The Super Bowl is the keystone that supports that structure.
The broadcaster is a conditional winner. NBCUniversal set an all-time Super Bowl ad sales record and used it to anchor a bundled February sales strategy across the Super Bowl, the Olympics, and NBA All-Star Weekend, with more than 250 unique advertisers and roughly 70 percent buying across multiple events. But the division still posted an adjusted EBITDA loss for the quarter. The Super Bowl subsidized a heavy rights portfolio; it did not by itself make the portfolio profitable.
Hotels were unambiguous winners. San Francisco area hotels reportedly hit 79 percent occupancy at a $392 average daily rate during Super Bowl week, described as roughly a 111 percent ADR increase. For comparison, the pre-event forecast for San Francisco’s February ADR was $293.69. This is the cleanest cash beneficiary in the entire chain, and it is worth noting that a substantial share of hotel profit flows to national and international ownership rather than staying local.
Resellers and hospitality packagers captured the ticket spread. Legends Global captured record merchandise volume. Sportsbooks and state tax authorities shared in $1.76 billion of estimated legal wagering. Restaurants, rideshare drivers, airlines, and event staff captured a genuine but diffuse slice.
The participating clubs, counterintuitively, do not receive a windfall from the game itself. The financial reward of reaching the Super Bowl is largely indirect: franchise valuation, sponsorship leverage, and season-ticket demand.
The Break-Even Question Nobody Asks
For the NFL, break-even on the Super Bowl is not a meaningful concept. The event is the product’s climax, its costs are absorbed league-wide, and its revenue is contractually locked years ahead. There is no plausible scenario in which the league loses money on the game.
For the broadcaster, break-even is meaningful and is measured against the annual rights fee, not against the day’s production budget. On roughly $2 billion a year in rights and a Super Bowl ad haul in the $800 million range, the game covers a large minority of the annual obligation. The other 51 weeks must cover the rest.
For an advertiser, break-even is brutal and rarely disclosed. As shown earlier, a $20 million all-in campaign at 40 percent gross margin requires roughly $50 million in attributable incremental revenue. A brand buying the Super Bowl for awareness, recruitment, investor signaling, or category defense may be making a perfectly rational decision, but it should not pretend the decision is a direct-response one.
For the host region, break-even is a public policy question. Santa Clara structured its participation to reach break-even by contract, through reimbursement, which is arguably the smartest municipal move in the entire event. Note what that means: the city’s stated financial goal was to not lose money. Not to profit.
Did the Event Actually Make Money?
For the NFL: almost certainly yes, substantially, though no audited Super Bowl-specific profit and loss statement is public.
For NBCUniversal: it made record revenue, and the segment that houses it lost money on an adjusted EBITDA basis in the same quarter. The Super Bowl was a commercial triumph inside a division under cost pressure.
For On Location and TKO: revenue grew, but at a 15 percent segment margin, and the company itself attributed the quarter’s hospitality surge primarily to the Olympics.
For the Bay Area: this is the contested one.
The Bay Area Host Committee, using analysis developed by Boston Consulting Group with a multi-regional input-output model in IMPLAN on 2024 Bay Area data, reported approximately $720 million in total economic impact, allocated roughly $425 million to San Francisco County, $195 million to Santa Clara County, and $100 million across the remaining counties, plus approximately $330 million in labor income, $20 million in fiscal revenue to local governments, and about 4,000 jobs supported, from roughly 90,000 visitors from outside the Bay Area.
Read the footnotes. The report itself defines those 4,000 jobs as “job-years,” meaning full-time-equivalent employment for one year, not 4,000 new permanent positions. The model inputs are visitor spending, organizational spending by teams and media, and logistics and operations spending, which are then run through IMPLAN to generate direct, indirect, and induced effects. Induced effects are, by construction, multiplied estimates, not observed transactions.
Now run the ratios. Fiscal revenue of $20 million equals 2.78 percent of the $720 million headline. Labor income of $330 million equals 45.83 percent. Divide $720 million by 90,000 outside visitors and you get $8,000 of modeled impact per visitor, which is only coherent because multipliers are doing heavy lifting on top of much smaller direct spend.
And the figure moved. Week-of reporting cited roughly $500 million in Bay Area impact, the state projected about $555 million, the pre-event study projected $370 million to $630 million, and the June post-event report landed at approximately $720 million. Four numbers, one event.
The academic literature is the necessary counterweight. Victor Matheson and Robert Baade, examining host cities from 1970 to 2001, concluded that the Super Bowl contributes approximately one-quarter of what boosters promise. NC State professor Mike Edwards, assessing the contemporary event, argues that net direct income to local residents is often far smaller than headline figures once public costs, visitor displacement, and profit leakage to national chains are subtracted, and identifies security, emergency services, infrastructure, crowding out of regular tourists, environmental effects, and gentrification pressure as real offsetting factors. He also notes plainly that the NFL is the biggest financial winner.
None of this means Super Bowl LX produced zero local benefit. Hotel data alone shows a genuine, measurable demand surge. It means the $720 million figure answers the question “how much economic activity can be modeled as associated with this event,” not the question “how much better off is the Bay Area, net of what it spent and net of what would have happened anyway.”
What Went Right
Selling out advertising inventory in September, before a single game of the season had been played, was the standout commercial decision. It removed market risk entirely and let NBCU set price rather than discover it.
Bundling the Super Bowl with the Winter Olympics and NBA All-Star Weekend was the second. It converted a one-day asset into a February package, pulled roughly 70 percent of advertisers into multi-event commitments, and manufactured demand pressure that pushed premium units past $10 million.
Refusing to expand inventory despite excess demand was the third, and the most disciplined. Scarcity was the product.
On the host side, Santa Clara’s reimbursement-and-backstop agreement was a genuinely sophisticated piece of municipal risk transfer, even if two of the seven votes thought it did not go far enough.
What Went Wrong
The ticket resale market fell nearly 30 percent from its post-conference-championship peak. Anyone who bought early paid a premium for a matchup that the market subsequently repriced downward, partly because of a late supply push and partly because Levi’s Stadium is smaller and the region more geographically sprawling than recent hosts.
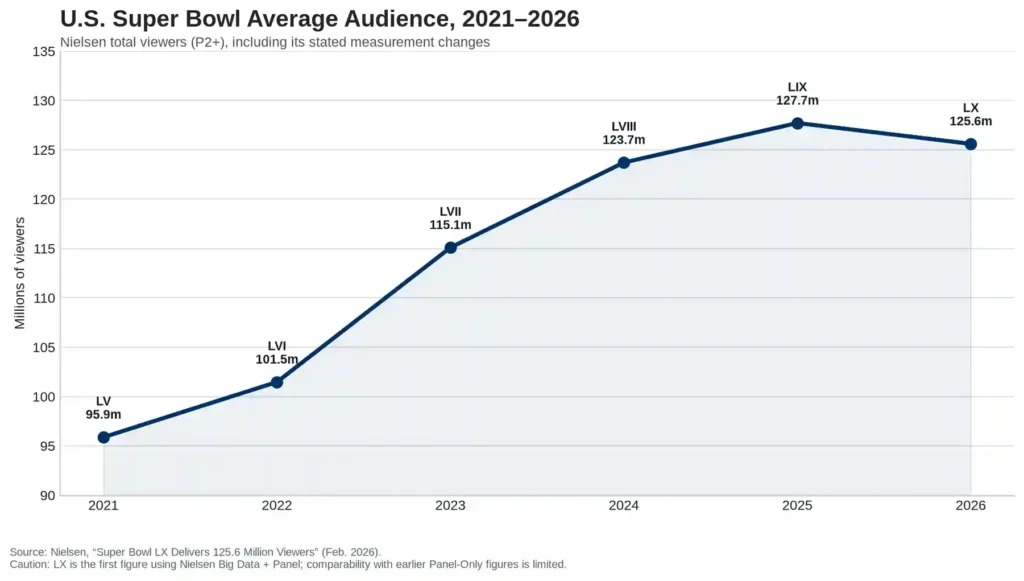
Nielsen’s initial estimate of 124.9 million had to be revised to 125.603 million after a big data provider failed to properly collect device data on game day. The revision was upward and modest, but it landed on the first Super Bowl measured under the new Big Data plus Panel methodology, which means the entire year-over-year comparison carries an asterisk. Super Bowl LX came in 1.65 percent below Super Bowl LIX’s 127.713 million and 1.53 percent above Super Bowl LVIII’s 123.714 million, but prior years used Panel-Only measurement. Anyone declaring a demand decline or a growth trend from that series is overreading the data.
And the economic impact communications were, at minimum, undisciplined. Publishing $500 million, $555 million, and $720 million for the same event within four months invites exactly the skepticism the academic literature has been voicing for two decades.
The Biggest Financial Risks
Concentration risk is the structural one: an entire year of a broadcaster’s advertising outperformance rides on a single Sunday that cannot be rescheduled or repeated.
Cost inflation on the rights side is the live one. Comcast’s own quarter showed what happens when Super Bowl and Olympic revenue arrives alongside NBA rights costs.
Measurement risk is newly relevant. When the currency by which advertising is priced changes methodology, every historical benchmark becomes negotiable.
Counterparty risk was the one Santa Clara’s dissenting votes were worried about, and it was mitigated rather than eliminated.
For attendees, the risk is contractual. Super Bowl ticket terms have historically stated that sales are final with no refunds or exchanges, that the ticket is a revocable license for a single entry with no re-entry right, that date and time may change, and that the exclusive remedy in cancellation scenarios is capped at face value rather than the resale price paid. A fan who paid $6,500 for a $950 face-value seat is exposed to a remedy gap of more than $5,500 that no amount of enthusiasm closes. Terms vary by edition, so the current contract is the only one that matters for any future game.
Who Really Benefited
The NFL, decisively and by design. Hotels, immediately and in cash. Ticket resellers and hospitality packagers, on the spread. Merchandise operators, on record volume. Sportsbooks and state treasuries, on $1.76 billion in estimated handle. Airlines, restaurants, and rideshare, diffusely.
The broadcaster benefited strategically while its segment lost money that quarter. Host cities benefited from exposure and activity while structuring their agreements primarily to avoid losses. Advertisers benefited in ways that remain, in aggregate, unproven from public evidence. Players received fixed CBA bonuses totaling roughly $15 million across both rosters.
To the credit of the parties involved, the NFL Foundation, the Bay Area Host Committee, and the 49ers Foundation directed more than $8.2 million in grants and funding to Bay Area community programs. That is a documented, verifiable local benefit, and notably it is a distribution decision rather than a modeled multiplier.
What Other Events Can Learn
Sell scarcity, not seats. NBCU’s refusal to expand inventory was worth more than any incremental unit would have been.
De-risk your revenue before you incur your costs. An early sell-out converts a speculative event into a booked one.
Bundle a tentpole with adjacent inventory. One irreplaceable event can pull along a dozen replaceable ones.
Structure municipal participation as reimbursement, not aspiration. A break-even contract beats a $720 million forecast, because only one of them is enforceable.
Publish dollars or expect to be doubted. Percentage-only merchandise disclosures and shifting impact estimates train the audience to discount your numbers.
Finally, distinguish the customer from the beneficiary. The fan pays the hotel, the airline, the reseller, and the concessionaire. The league is paid by the networks. Understanding which side of that split you are on determines whether the biggest event in American sports is a windfall or an expense.
Final Financial Verdict
Questionable result, with one clear winner.
For the NFL, Super Bowl LX was a financial success, supported by strong evidence and no meaningful counterevidence. For NBCUniversal, it was a record-setting revenue event inside a loss-making quarter, which is the definition of a mixed outcome. For On Location and hospitality operators, it was solid revenue at thin margins. For the Bay Area, the result is genuinely uncertain: real hotel and visitor activity occurred, and the $720 million figure remains a sponsor-commissioned model output with $20 million of modeled local fiscal revenue against unaudited public costs across multiple jurisdictions.
There is no publicly available, independently audited profit and loss statement for Super Bowl LX from the NFL, NBCUniversal, On Location, Legends Global, the participating clubs, or the host committee. Anyone stating a precise event-level profit figure is estimating, and should say so.
The Final Lesson
The Super Bowl is the most reliable proof in American business that revenue and profit are different animals living in different cages. A broadcaster set an all-time advertising record and its division still lost money. A region announced $720 million in impact and a host city’s stated financial objective was simply to be reimbursed. A performer played to 128 million people for union scale. A fan paid $6,500 for a seat with a $950 face value and a remedy capped at face value.
Every one of those is a rational decision by a sophisticated party. None of them is the story the headline number tells. The event is enormous, and it is enormously profitable for exactly one organization. Everyone else is buying something other than money.
Financial Disclaimer: This article is for informational and educational purposes only. Several figures cited are estimates, projections, or reported figures published by third parties rather than audited results. Event economics here are reconstructed from publicly available information. Actual costs, revenue-sharing agreements, contracts, tax positions, and expenses associated with Super Bowl LX have not been fully disclosed publicly, and the estimates presented may differ materially from the internal financial results of the NFL, its clubs, its media partners, its hospitality and merchandise operators, or any host-region entity. Nothing here constitutes financial, investment, legal, tax, accounting, or professional advice, and readers should not rely on this analysis as a recommendation to invest in, participate in, organize, sponsor, or purchase anything related to this or any future event.
Sources
Nielsen, “Super Bowl LX Delivers 125.6 Million Viewers”: https://www.nielsen.com/news-center/2026/super-bowl-lx-2026/
NFL, “NFL completes long-term media distribution agreements through 2033 season”: https://www.nfl.com/news/nfl-completes-long-term-media-distribution-agreements-through-2033-season
NFL, “Seahawks-Patriots in Super Bowl LX: What We Learned”: https://www.nfl.com/news/seahawks-patriots-in-super-bowl-lx-what-we-learned-from-seattle-s-29-13-win
Bay Area Host Committee, post-event economic impact announcement: https://bayareahostcommittee.com/newsroom/bay-area-host-committee-announces-super-bowl-lx-exceeded-economic-impact-projections-generating-approximately-720-million-for-bay-area-region
Bay Area Host Committee and BCG, Economic Impact Report (June 2026): https://bayareahostcommittee.com/s/BAHC-Economic-Impact-Report-Post-SBLX.pdf
National Retail Federation, Super Bowl spending research: https://nrf.com/research-insights/holiday-data-and-trends/super-bowl
SportsPro, “NBCUniversal sells Super Bowl LX ads for US$10m”: https://www.sportspro.com/news/broadcast-ott/super-bowl-lx-nbcuniversal-advertising-spend-revenue-february-2026/
ADWEEK, “Super Bowl 60 Sets Ad Sales Record, According to NBCU”: https://www.adweek.com/convergent-tv/super-bowl-60-sets-ad-sales-record-nbcu/
CNBC, “Comcast (CMCSA) earnings Q1 2026”: https://www.cnbc.com/2026/04/23/comcast-cmcsa-earnings-q1-2026.html
TKO Group Holdings, First Quarter 2026 Results: https://investor.tkogrp.com/news/news-details/2026/TKO-Reports-First-Quarter-2026-Results/default.aspx
San Francisco 49ers, “On Location Releases Super Bowl LX Ticket Packages”: https://www.49ers.com/news/on-location-releases-super-bowl-lx-ticket-packages-featuring-once-in-a-lifetime-experiences-and-guaranteed-seat-locations
CBS Sports, “Super Bowl 60 tickets: All you need to know”: https://www.cbssports.com/nfl/news/super-bowl-60-tickets-all-you-need-to-know-patriots-vs-seahawks/
Front Office Sports, “Super Bowl LX Get-In Prices Fall Nearly 30% Since Matchup Set”: https://frontofficesports.com/super-bowl-lx-get-in-prices-fall-nearly-30-since-matchup-set/
Legends Global, record-breaking Super Bowl LX merchandise sales: https://legendsglobal.com/press-release-legends-global-announces-record-breaking-merchandise-sales-for-super-bowl-lx-in-san-francisco-bay-area/
San José Spotlight, “Santa Clara will be reimbursed millions for hosting Super Bowl”: https://sanjosespotlight.com/santa-clara-will-be-reimbursed-millions-for-hosting-2026-super-bowl/
TIME, “The Economics of the Super Bowl, By the Numbers”: https://time.com/7371897/super-bowl-2026-ads-ticket-prices-sports-betting-halftime-show/
American Gaming Association, Super Bowl LX wagering estimate: https://www.americangaming.org/americans-to-legally-wager-estimated-1-76-billion-on-super-bowl-lx/
NC State College of Natural Resources, “The Super Bowl’s Economic Impact: Big Game, Big Money, Big Costs”: https://cnr.ncsu.edu/news/2026/01/the-economic-impact-of-the-super-bowl/
Matheson and Baade, “Super Bowl or Super (Hyper)Bole? Assessing the Economic Impact of America’s Premier Sporting Event”: https://ideas.repec.org/p/wil/wileco/2003-15.html
CoStar with STR, “How Super Bowl LX will shape San Francisco’s hotel market”: https://www.costar.com/it-it/prodotti/str-benchmark/risorse/blog-informazioni-dai-dati/game-changing-metrics-how-super-bowl-lx-will-shape-san-franciscos-hotel-market
Sportcal, “Deep Dive: Will NBCU make a success of Super Bowl LX?”: https://www.sportcal.com/features/deep-dive-will-nbcu-make-a-success-of-super-bowl-lx/
NFL, “NFL Foundation, Bay Area Host Committee, 49ers Foundation contribute over $8 million”: https://www.nfl.com/news/nfl-foundation-bay-area-host-committee-49ers-foundation-contribute-over-8-million-to-bay-area-community-impact
Apple Newsroom, “The biggest hits of Bad Bunny’s Apple Music Super Bowl LX Halftime Show”: https://www.apple.com/newsroom/2026/02/the-biggest-hits-of-bad-bunnys-apple-music-super-bowl-lx-halftime-show/


Comments
Loading comments...