







YouTube Revenue: How Much Money Does Google Really Make From YouTube?
YouTube revenue has quietly transformed a 2006 stock-for-stock acquisition into one of the most profitable-looking deals in corporate history. Over nearly two decades, YouTube ad revenue and YouTube monetization have fueled the perception of an unstoppable money machine. Yet Alphabet has never published a single figure confirming that the transaction generated even one dollar of net profit.
That contradiction is the real story. Public disclosures support the top-line growth narrative, but they leave almost every subsequent assumption unproven: operating margins, total creator payouts, the split between advertising and subscriptions, a standalone valuation, or the actual return on the original purchase price. Alphabet reports the revenue and stops there.
What follows is limited strictly to what can be verified from the public record.
The $1.65 Billion Line That Started Everything
On October 9, 2006, Google filed a press release with the SEC announcing it had agreed to acquire YouTube for $1.65 billion in a stock-for-stock transaction. The document is short, and it is far more revealing than most retrospectives admit.
Google did not describe itself as buying a video website. It described buying “one of the largest and fastest growing online video entertainment communities” and combining it with “Google’s expertise in organizing information and creating new models for advertising on the Internet.” The filing stated that YouTube, founded in February 2005, was delivering more than 100 million video views every day with 65,000 new videos uploaded daily.
Read that as an acquirer would. Google was not paying for content it would own. It was paying for two flows: attention arriving daily, and supply arriving daily. Everything about YouTube’s later economics comes from the interaction of those two numbers.
The filing also contained a detail that mattered financially: “Following the acquisition, YouTube will operate independently to preserve its successful brand and passionate community.” Google explicitly declined to absorb the brand. Eric Schmidt’s quoted line about being “natural partners” for “users, content owners and advertisers” named all three sides of the business model before the business model existed.
There is one more thing worth noticing. The price was paid in stock, and the share count was to be determined by a 30-day average closing price two trading days before completion. Google spent equity, not cash, on an unproven asset with well-documented copyright exposure. That structure transferred part of the risk to YouTube’s shareholders in the form of Google stock, and it preserved Google’s cash. It was, in hindsight, a cheap way to buy an option on the future of video.
But this is where the financial story gets complicated. Almost nobody can tell you what that option cost to exercise.
Where the Financial Story Really Started: A Platform, Not a Studio
In 2010, co-founder and then-CEO Chad Hurley published a retrospective on the official YouTube blog describing the site’s origin: the domain was registered on February 14, 2005, with the objective that anyone with a video camera and an internet connection could share a story with the world.
The economically significant part of that post was not nostalgia. Hurley articulated a partner-oriented logic YouTube’s job was not to create content but to provide distribution at scale, revenue models, and tools that let partners control and monetize their work.
That sentence, written in 2010, is effectively the blueprint for every dollar of YouTube monetization that followed. A studio buys content and owns the upside. A platform rents distribution and keeps a cut. The second model requires far less capital per hour of programming and scales without a commissioning budget, but it permanently ties the platform’s fortunes to the willingness of outsiders to keep uploading.
YouTube chose to be a landlord rather than a producer. Every later decision revenue share percentages, Content ID, fan funding, shopping follows from that choice.
The First Real Money: A Number Nobody Saw Until 2020
Here is an underappreciated fact about YouTube ad revenue: for the first fourteen years of Google’s ownership, the public had no idea what it was.
Google, and later Alphabet, folded YouTube inside its advertising results and disclosed nothing separately. Analysts guessed. Trade publications guessed. Everyone was working from inference.
That changed with Alphabet’s disclosure of YouTube advertising revenue of $15.149 billion for 2019. Suddenly the platform had a verified financial identity. And what the disclosure revealed was a business already larger than most publicly traded media companies, hiding inside a search company’s income statement.
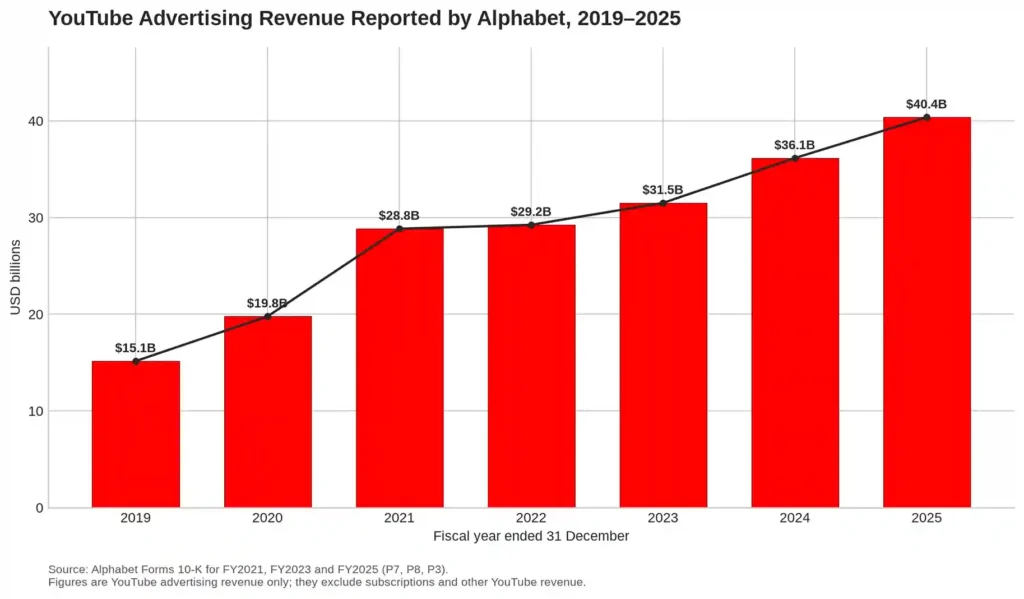
The trajectory since then, all taken from Alphabet’s SEC-filed annual reports, tells a story in three acts:
2019 brought $15.149 billion. 2020 brought $19.772 billion, up 30.52%. 2021 brought $28.845 billion, up 45.89%. Then 2022 delivered $29.243 billion an increase of just 1.38%. Growth resumed at $31.510 billion in 2023 (up 7.75%), $36.147 billion in 2024 (up 14.72%), and $40.367 billion in 2025 (up 11.67%).
Across the full 2019 to 2025 span, that works out to a compound annual growth rate of 17.74%.
Most coverage stops at the growth. The more interesting number is the one that didn’t grow.
2022: The Year the Machine Stalled
A 1.38% increase is not a rounding error in a business that had just grown 45.89%. It is a structural warning, and it deserves more attention than it usually gets.
Consider what happened around that period. The pandemic-era comparison base was inflated. Advertiser budgets tightened. Short-form video competition intensified, and Shorts YouTube’s own answer to that competition monetizes on a different and less mature economic basis than long-form watch pages. Privacy changes across the digital advertising industry made targeting and measurement harder.
Alphabet’s filings do not attribute the 2022 slowdown to a single cause, and no responsible reading should invent one. What the year proves is narrower but important: YouTube ad revenue is cyclical, competitive, and not guaranteed to compound. Anyone modeling the platform as a permanent double digit grower has a 2022 problem.
That decision to diversify, which had been running quietly in the background for years, suddenly looked less like an experiment and more like insurance.
The $60 Billion Sentence and the Missing $19.633 Billion
For the 2025 fiscal year, Alphabet said something it had never said before: revenue across YouTube ads and subscriptions exceeded $60 billion.
Set that beside the separately reported YouTube ad revenue of $40.367 billion and you get a simple piece of arithmetic. More than $60 billion in total, minus $40.367 billion in advertising, leaves more than $19.633 billion of included non-advertising revenue.
That inference deserves careful handling, and this is where a lot of online commentary goes wrong. Alphabet’s language was “exceeded,” not “equaled,” so the true residual could be meaningfully higher. Alphabet did not publish the exact total. It did not define every item swept into the subscription category. And it provided no split between YouTube Premium, YouTube Music, YouTube TV, NFL Sunday Ticket, memberships, or anything else.
So the honest statement is this: the public record establishes a floor of more than $19.633 billion in non-ad YouTube revenue for 2025. It does not establish a subscription revenue figure. It certainly does not establish what any of it costs to produce.
Still, the strategic implication is real. Nearly a third of disclosed YouTube revenue in 2025 came from something other than advertising. The platform that Google bought as an ad play has become, by revenue mix, a hybrid.
The Subscription Business Alphabet Won’t Break Out
Alphabet’s FY2025 Form 10-K identifies YouTube TV, YouTube Music and Premium, and NFL Sunday Ticket within its consumer subscription business. Those are four distinct economic propositions bundled under one brand: a live-TV replacement, a music streaming service, an ad-free video tier, and a premium sports rights package.
The company reported more than 325 million paid subscriptions across its consumer services at the end of 2025, led by Google One and YouTube Premium, and said that figure had reached 350 million in the first quarter of 2026, with YouTube and Google One as key drivers.
Twenty-five million net additions in a quarter is a serious number. But notice what it is not. It is an Alphabet-wide figure covering multiple products. It does not tell you how many YouTube Premium subscribers exist, how many YouTube TV households there are, what any of them pay on average, what churn looks like, or what it costs to acquire them.
And subscriptions are not free money. YouTube TV carries carriage costs. NFL Sunday Ticket carries sports rights costs, which in the broader industry are typically enormous, fixed, and contractually locked for years. Music carries licensing obligations. Every one of those is a real expense, and Alphabet discloses none of them at the YouTube level.
This is the single most important limitation in the entire story. A revenue line without a cost line tells you about scale, not about value creation.
The Creator Economy Math: 55, 45, and 70
The supply side of YouTube monetization is documented with unusual precision and misread constantly.
According to YouTube’s official partner earnings documentation, eligible partners who accept the Watch Page Monetization Module receive 55% of net revenues from ads displayed or streamed on their public Watch Page videos. Partners accepting the Shorts Monetization Module receive 45% of the revenue allocated to them based on their share of views from the Creator Pool allocation. Partners accepting the Commerce Product Module receive 70% of net revenues from channel memberships, Super Chat, Super Stickers, and Super Thanks.
Four things about those numbers get lost in translation.
First, “net revenues” is not gross advertiser spend. Whatever the advertiser pays, the creator’s percentage applies to a smaller base after YouTube’s deductions.
Second, Shorts is not simply long-form with a lower percentage. The 45% applies to an allocation from a Creator Pool based on view share, which is a fundamentally different mechanism than a direct ad-to-video attribution. As short-form consumption grows, that difference reshapes creator earnings in ways a headline percentage cannot capture.
Third, the 70% fan-funding rate is the most generous published share and it is the one that requires an audience willing to hand over money voluntarily. YouTube pays out more where it takes on less inventory risk.
Fourth, YouTube’s own documentation warns that estimated revenue can be adjusted for invalid traffic, Content ID claims, disputes, and certain campaign types, with final earnings flowing through AdSense.
Put together, those published percentages describe the rules of a system. They do not predict any individual channel’s income, and any article that multiplies views by a revenue share to produce a creator’s “earnings” is manufacturing a number.
The $100 Billion Claim, Handled Carefully
In his January 2026 letter, YouTube CEO Neal Mohan stated that in the past four years alone the platform had paid over $100 billion to creators, artists, and media companies.
That is an extraordinary figure, and it is also a management statement rather than an audited disclosure. It is worth being precise about what it does and does not say. It covers four years, not one. It covers creators, artists, and media companies together, so a large share may flow to record labels, sports leagues, and traditional media rights holders rather than to independent channel owners. And it is not presented as an operating expense line reconciled to any filed financial statement.
What it does establish is intent. YouTube is publicly positioning partner payouts as a strategic investment, not a cost to be minimized. In a landlord model, that is rational the tenants are the inventory.
Where the Money Actually Goes, and Why We Can’t See It
Here is the part of the story the public record simply refuses to answer.
A standalone YouTube cost structure would plausibly include video storage and delivery at planetary scale, data center capacity, product and machine learning engineering, a global advertising sales organization, trust and safety operations, content moderation, copyright and rights administration, payment processing across hundreds of markets, creator revenue sharing, sports and media rights, marketing, and legal and regulatory compliance.
That missing cost line matters even more in generative video, where every new output carries a real compute bill. Our analysis of AI video pricing and unit economics shows why revenue growth alone cannot tell you whether a video platform’s economics actually work.
Alphabet allocates none of that to YouTube publicly. YouTube is not a reportable segment. It sits inside Google Services. There is no standalone YouTube income statement, no operating margin, no content-acquisition cost, no annual creator-payout total tied to a filing, no free cash flow, and no acquisition internal rate of return.
Which means every confident claim you have ever read about YouTube’s profitability is an estimate wearing a suit.
To put the scale in perspective using only reported figures: YouTube ads of $40.367 billion represented 13.70% of Alphabet’s 2025 Google advertising revenue of $294.691 billion and 10.02% of Alphabet’s consolidated revenue of $402.836 billion. That establishes materiality. It says nothing about YouTube’s share of Alphabet’s profit, assets, capital expenditure, or enterprise value and it would be a mistake to assume those percentages travel.
The Bill That Came Due: $170 Million and a Business Model Change
Not every financial turning point is a growth number. Some are enforcement actions.
In September 2019, the Federal Trade Commission announced that Google and YouTube would pay $170 million, $136 million to the FTC and $34 million to New York to settle allegations that YouTube collected persistent identifiers from viewers of child-directed channels without parental notice and consent, and used them for targeted advertising. The settlement required, among other things, a system for channel owners to designate child directed content, notice to channel owners, and annual employee training on COPPA compliance.
The penalty was, by Alphabet’s standards, small. The operational consequence was not. Requiring creators to classify content as child-directed, and restricting data use and targeting on that content, changed the monetization economics of an entire category of channels. Family and children’s creators who had built audiences under one set of rules found their revenue mechanics altered.
That is the lesson worth extracting: regulation didn’t just cost Google money, it rewrote the product. And the cost of the rewrite engineering, classification systems, lost targeting value, creator churn never appeared anywhere as a disclosed number.
Alphabet’s current filing signals more of the same ahead, identifying evolving rules on AI, competition, consumer protection, content moderation, access restrictions for minors, data privacy, security, copyright, and online content as risks that may require product changes, compliance costs, or changes to business practices.
The Reacceleration, and What the Latest Numbers Show
The most recent disclosures available at this writing show the advertising engine running again.
Alphabet reported YouTube advertising revenue of $9.883 billion in the first quarter of 2026, up from $8.927 billion a year earlier, and $11.055 billion in the second quarter of 2026, up from $9.796 billion. Combined, first half 2026 YouTube ad revenue reached $20.938 billion versus $18.723 billion in the first half of 2025, an increase of 11.83%.
Resist the urge to double it. Advertising is seasonal, with fourth quarters historically carrying disproportionate weight. Products change. Macroeconomic conditions change. Alphabet does not publish a YouTube specific annual forecast, and neither should anyone else pretending to read one out of two quarters.
What the half-year does confirm is direction. As of the most recent filings, growth is continuing at a rate roughly consistent with 2024 and 2025 rather than reverting to the 2022 stall.
The Turning Points That Rewrote the Economics
Strip the twenty-year story down to its load-bearing moments and roughly seven stand out.
February 2005 established the mission when the domain was registered with the goal of letting anyone with a camera and a connection share a story globally. That framing determined that YouTube would be a distribution business rather than a content owner.
October 2006 transferred ownership for $1.65 billion in stock, attaching a fast-growing video community to an advertising infrastructure it could never have built alone, while explicitly preserving the brand.
Around 2010, the partner logic crystallized publicly distribution, revenue models, and control tools for rights holders converting an upload site into an ecosystem with defined economics.
September 2019 delivered the COPPA settlement, proving that content classification, minors’ data, and ad targeting design could directly reshape monetization mechanics.
The 2019 through 2021 stretch took disclosed ad revenue from $15.149 billion to $28.845 billion, establishing the platform as a top-tier global advertising property in the open.
2022 broke the growth narrative with a 1.38% increase, exposing cyclicality and competitive pressure and validating the diversification strategy.
And the 2023 through 2025 recovery, reaching $40.367 billion in ads and more than $60 billion including subscriptions, completed the transition from an advertising business to a mixed-revenue platform with a documented non-ad floor above $19.633 billion.
What the Public Story Doesn’t Explain
The public story about YouTube is a story about scale. The financial story is about visibility, and how little of it exists.
Consider what an investor cannot determine from the filings. Whether YouTube TV is profitable. Whether NFL Sunday Ticket earns back its rights cost. Whether YouTube Premium’s margin resembles Spotify’s or something far better. Whether Shorts monetizes at a level that offsets the long-form watch time it may cannibalize. Whether the $100 billion in four year partner payments represents 40% of revenue or 60%. Whether YouTube’s capital intensity is rising with AI infrastructure demands.
Every one of those questions has an answer inside Alphabet. None of them has a public one.
There is a reasonable argument that this opacity is itself a strategic asset. Alphabet is not obligated to hand competitors, regulators, or negotiating partners a detailed view of the economics of the world’s largest video platform. Music labels, sports leagues, and creator representatives all negotiate against YouTube. A published margin would be a bargaining chip handed to the other side of the table.
The counter argument is equally reasonable: a business generating more than $60 billion in annual revenue inside a company generating $402.836 billion is material enough that investors are being asked to take a great deal on faith.
What the Financial Journey Actually Teaches
The first lesson is about the difference between buying revenue and buying a position. Google spent $1.65 billion in stock on a company with essentially no proven business model, 100 million daily views, and serious legal exposure. It was not paying for cash flows. It was paying for a network effect that was already compounding and would have been expensive or impossible to replicate. The best acquisitions are often priced against what exists rather than what will exist.
The second lesson is about concentration. Even after two decades and a genuine subscription business, the clearest disclosed revenue line remains advertising, and advertising is cyclical. 2022 demonstrated that in a single line of a filing. Diversification improved resilience; it did not eliminate exposure.
The third lesson is that revenue-share percentages are product design, not marketing. The 55%, 45%, and 70% figures set incentives that determine what gets made and by whom. A platform that pays more for fan funding than for ad inventory is telling creators something about which behaviors it wants to encourage. Anyone building a marketplace should read those numbers as a strategy document.
The fourth lesson is that scale summons governance costs. The FTC settlement and Alphabet’s own risk disclosures show that privacy, minors’ safety, moderation, copyright, and advertising practices can force product changes with real economic weight. Growth without credible compliance systems risks damaging the exact advertiser and creator relationships that generate the revenue.
The fifth and most uncomfortable lesson is about the limits of public information. Revenue is proven. Profitability is not. Those are different claims, and the distance between them is where most bad financial analysis lives.
Final Takeaway
The most honest summary of YouTube’s financial story is also the least satisfying one. A $1.65 billion stock purchase in 2006 became a platform disclosing $40.367 billion in annual advertising revenue and more than $60 billion across ads and subscriptions by 2025, with a documented growth rate of 17.74% annually over the 2019 to 2025 window and continued growth into the first half of 2026.
That is a spectacular outcome by any commercial measure. It is not, however, a proven return, because Alphabet has never published the cost side of the equation. The revenue is verified. The profit is unexamined territory.
For advertisers, the evidence supports YouTube as a scaled venue for both performance and brand objectives, subject to their own measurement. For creators, it supports the existence of multiple monetization paths, not stable or universal earnings. For investors, it supports a conclusion of materiality within Alphabet, not a standalone valuation. For everyone else, it supports something simpler and more useful: the reminder that a very large number on the top line is a fact, and everything you assume follows from it is a guess.
Follow the money far enough at YouTube and you eventually hit a wall. The interesting part is that the wall is deliberate.
Financial Disclaimer: This article is provided for informational and educational purposes only. It is based on publicly available information and the cited sources listed below. It does not constitute financial, investment, legal, tax, or accounting advice, and it should not be relied upon as a recommendation to buy, sell, hold, invest, or make any financial decision. Figures identified as inferences or calculations are analytical in nature and are not company-reported metrics. Readers should consult a qualified professional before acting on any financial information.
Sources
Google Inc., “Google To Acquire YouTube for $1.65 Billion in Stock,” SEC Exhibit 99.1, October 9, 2006. https://www.sec.gov/Archives/edgar/data/1288776/000119312506206884/dex991.htm
Alphabet Inc., Form 10-K for the fiscal year ended December 31, 2021, SEC filing. https://www.sec.gov/Archives/edgar/data/1652044/000165204422000019/goog-20211231.htm
Alphabet Inc., Form 10-K for the fiscal year ended December 31, 2023, SEC filing. https://www.sec.gov/Archives/edgar/data/1652044/000165204424000022/goog-20231231.htm
Alphabet Inc., Form 10-K for the fiscal year ended December 31, 2025, SEC filing. https://www.sec.gov/Archives/edgar/data/1652044/000165204426000018/goog-20251231.htm
Alphabet Inc., “Alphabet Announces Fourth Quarter and Fiscal Year 2025 Results,” SEC Exhibit 99.1, February 2026. https://www.sec.gov/Archives/edgar/data/1652044/000165204426000012/googexhibit991q42025.htm
Alphabet Inc., “Alphabet Announces First Quarter 2026 Results,” SEC Exhibit 99.1, April 29, 2026. https://www.sec.gov/Archives/edgar/data/1652044/000165204426000043/googexhibit991q12026.htm
Alphabet Inc., “Second Quarter 2026 Results,” SEC Exhibit 99.1, July 22, 2026, and Alphabet Investor Relations Q2 2026 earnings call materials. https://abc.xyz/investor/events/event-details/2026/2026-Q2-Earnings-Call-2026-GgTAq7Is0z/default.aspx
YouTube Help, “YouTube partner earnings overview,” official platform documentation. https://support.google.com/youtube/answer/72902
Neal Mohan, “From the CEO: What’s coming to YouTube in 2026,” YouTube Official Blog, January 2026. https://blog.youtube/inside-youtube/the-future-of-youtube-2026/
Chad Hurley, “YouTube & the Online Video Revolution,” YouTube Official Blog, February 14, 2010 (as cited in the source report).
U.S. Federal Trade Commission, “Google and YouTube Will Pay Record $170 Million for Alleged Violations of Children’s Privacy Law,” September 4, 2019. https://www.ftc.gov/news-events/news/press-releases/2019/09/google-youtube-will-pay-record-170-million-alleged-violations-childrens-privacy-law
Office of the New York State Attorney General, “AG James: Google and YouTube to Pay Record Figure for Illegally Tracking and Collecting Personal Information from Children,” September 2019. https://ag.ny.gov/press-release/2019/ag-james-google-and-youtube-pay-record-figure-illegally-tracking-and-collecting
TechCrunch, “Google gains 25M subscriptions in Q1, driven by YouTube and Google One,” April 29, 2026. https://techcrunch.com/2026/04/29/google-gains-25m-subscriptions-in-q1-driven-by-youtube-and-google-one/
Variety, “YouTube Revenue for Full-Year 2025 Topped $60 Billion,” February 2026. https://variety.com/2026/digital/news/youtube-2025-total-revenue-ads-subscriptions-alphabet-earnings-1236652260/


Comments
Loading comments...